Fig. 7
Download original image
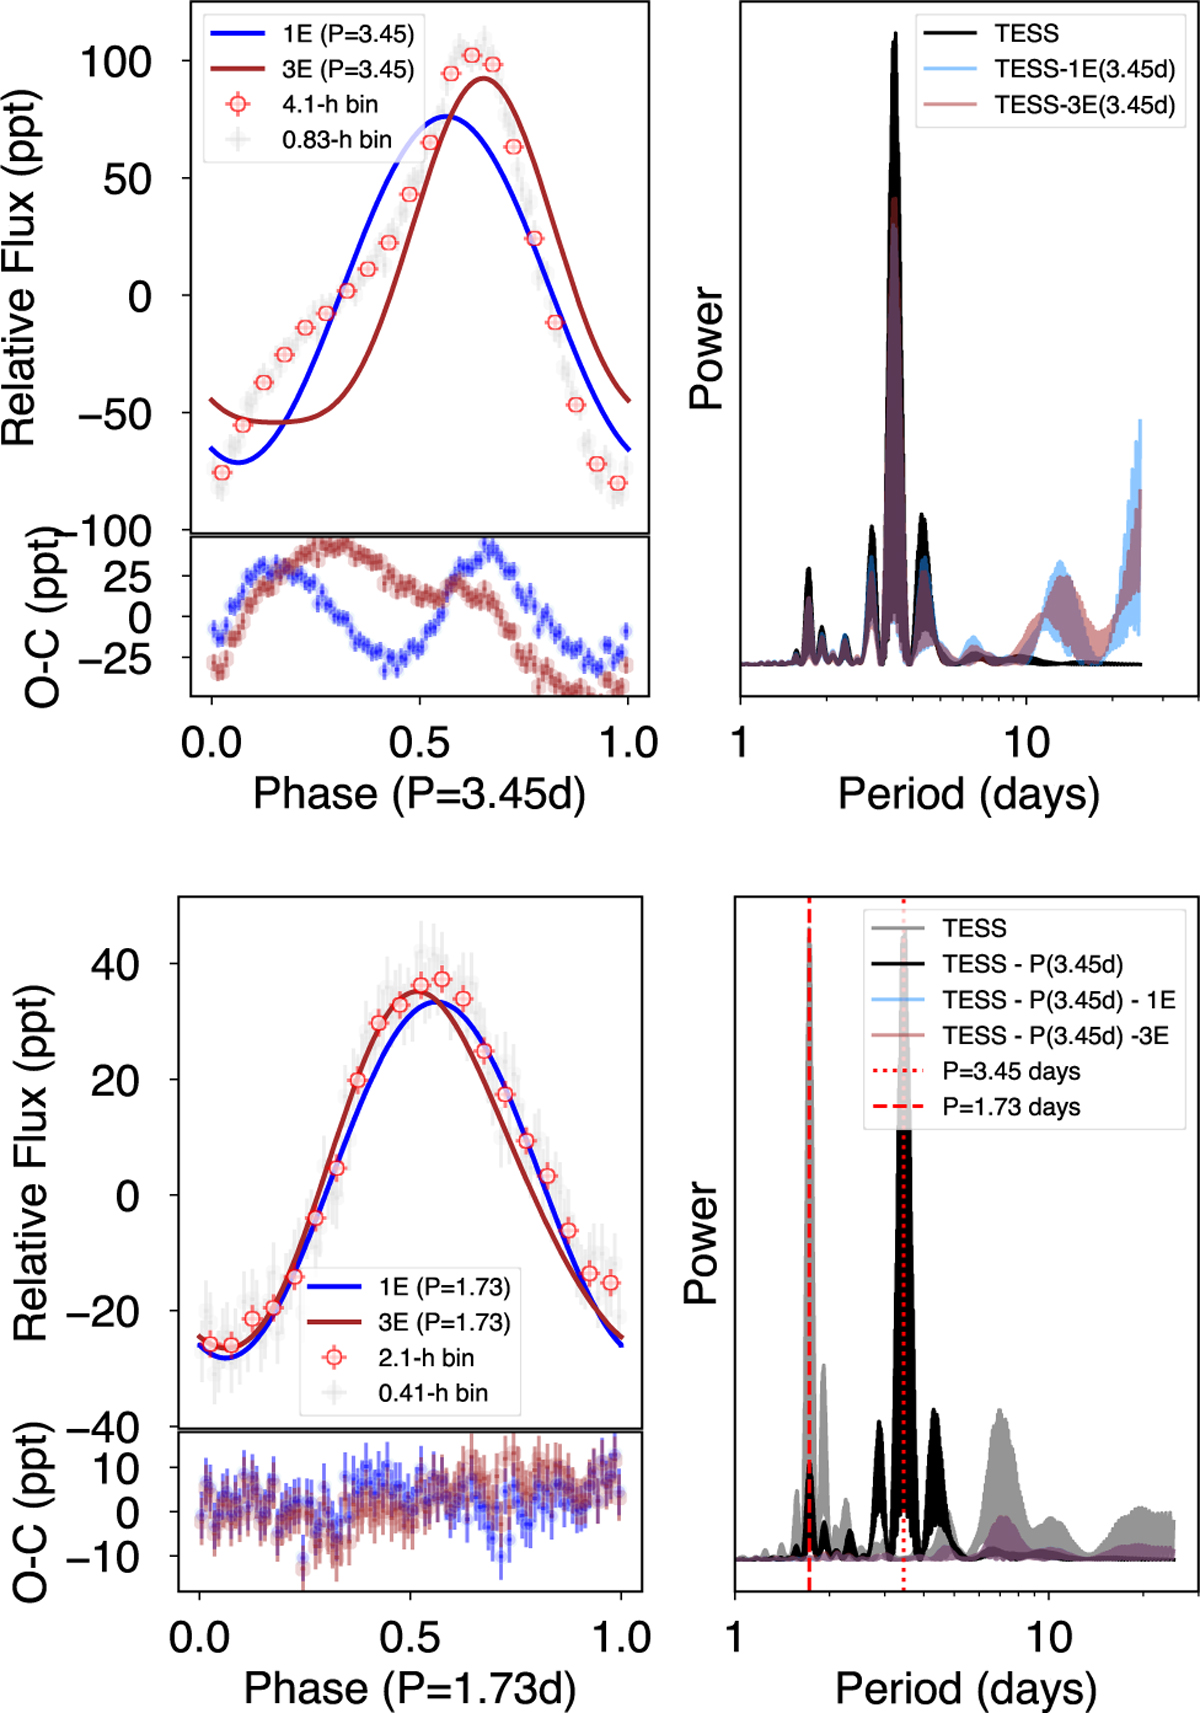
Modelling of the WPS 54 TESS light curve. Top panels: phase- folded light curve (top-left) with the periodicity corresponding to the largest peak in the periodogram (top-right panel), including the 1E (blue) and 3E (red) models and their corresponding residuals. The model is not satisfactory due to the presence of additional signals. Bottom panels: phase-folded light curve (bottom-left) with the 1.73 d periodicity after removing the sinusiondal patter corresponding to the 3.45 d (potentially the rotation period). The 1E (blue) and 3E (red) models are shown, as well as their corresponding residuals.
Current usage metrics show cumulative count of Article Views (full-text article views including HTML views, PDF and ePub downloads, according to the available data) and Abstracts Views on Vision4Press platform.
Data correspond to usage on the plateform after 2015. The current usage metrics is available 48-96 hours after online publication and is updated daily on week days.
Initial download of the metrics may take a while.