Open Access
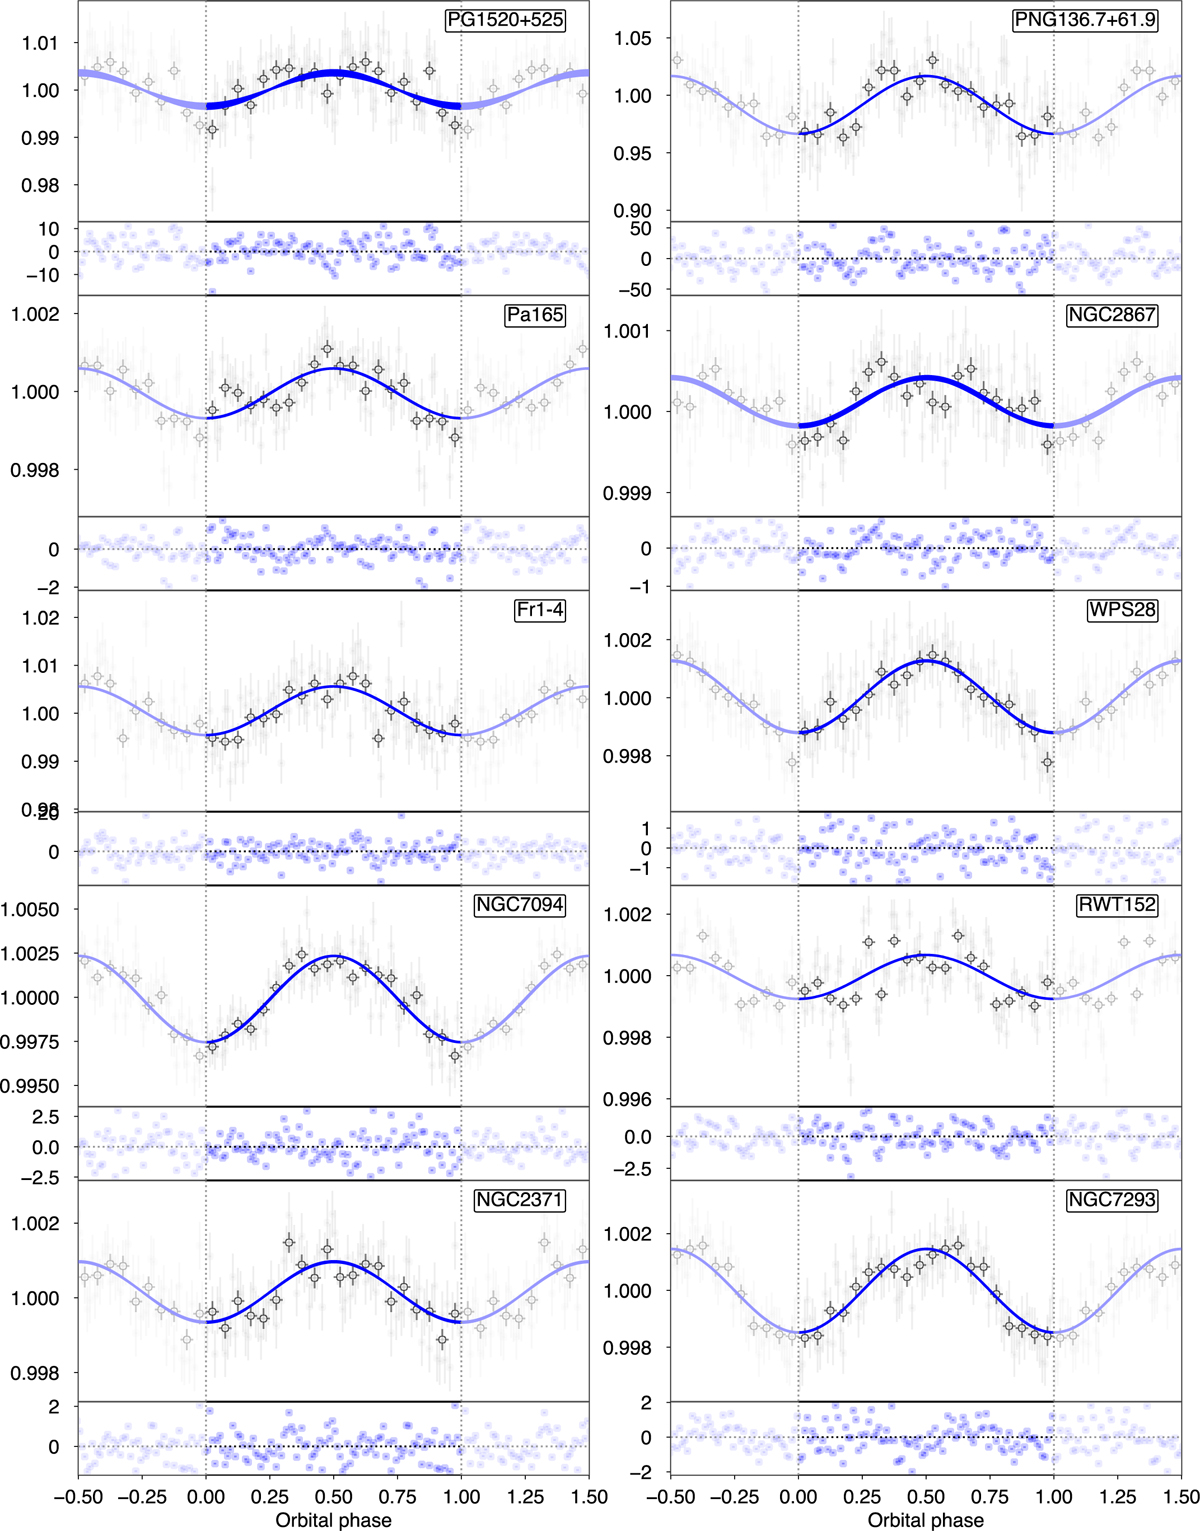
Fig. A.1
Download original image
Results from the MCMC analysis for the proposed binary candidates. 1E solution is plotted in blue and 3E solution in red. Two different bin sizes are shown with black (bin size of 0.01 in phase) and grey (bin size of 0.05 in phase) symbols. The period derived from the fitting in each case can be found in Tables 4 and 5.
This figure is made of several images, please see below:
Current usage metrics show cumulative count of Article Views (full-text article views including HTML views, PDF and ePub downloads, according to the available data) and Abstracts Views on Vision4Press platform.
Data correspond to usage on the plateform after 2015. The current usage metrics is available 48-96 hours after online publication and is updated daily on week days.
Initial download of the metrics may take a while.