Fig. 11
Download original image
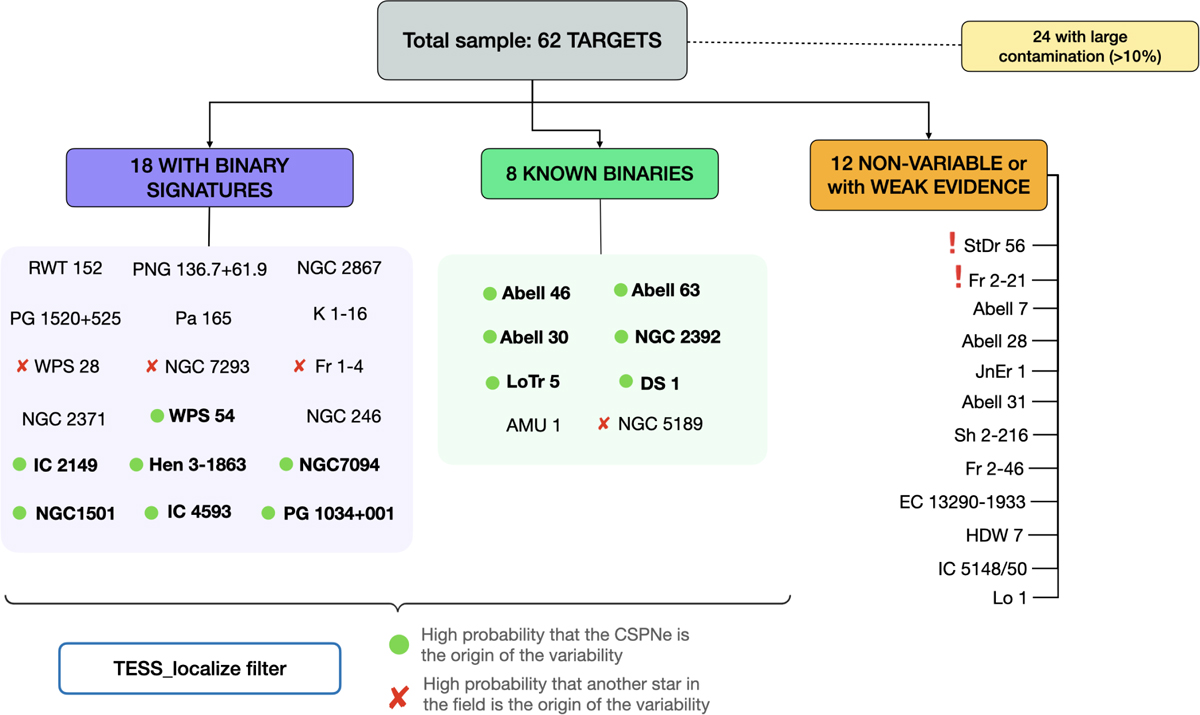
Results after the MCMC variability analysis of the total sample of central stars of planetary nebulae. Green dots indicate those targets with a good location of the variability in the central source after applying TESS_localize and red crosses indicate those targets with high probability that the variability is due to other star in the field. Red X marks indicate those objects with weak evidence which may become binary candidates with more data.
Current usage metrics show cumulative count of Article Views (full-text article views including HTML views, PDF and ePub downloads, according to the available data) and Abstracts Views on Vision4Press platform.
Data correspond to usage on the plateform after 2015. The current usage metrics is available 48-96 hours after online publication and is updated daily on week days.
Initial download of the metrics may take a while.