Fig. 4

Download original image
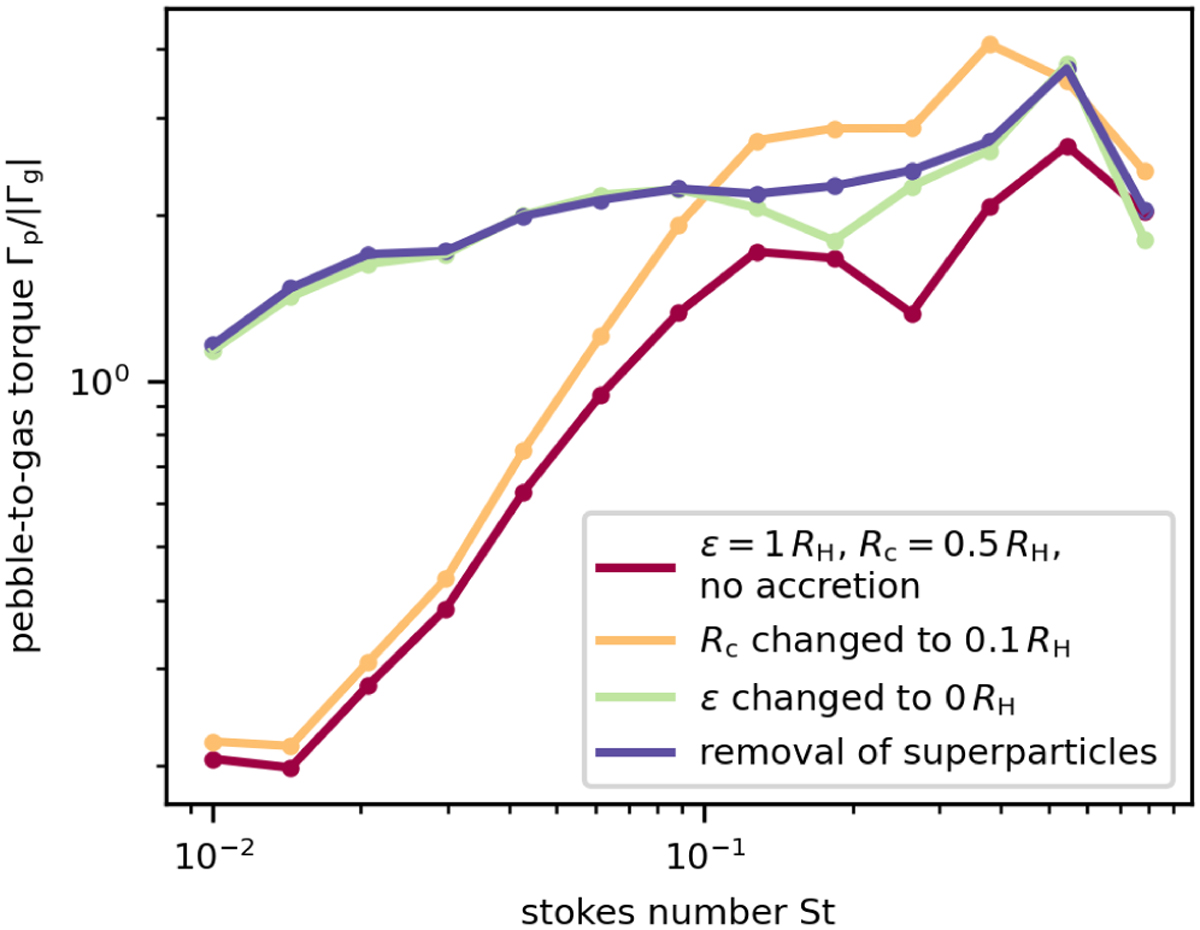
Pebble-to-gas torque as a function of the Stokes number for the planet mass Mpl = 1.51 M⊕. Individual curves track how the torque changes when the key model assumptions are varied one at a time. The red curve corresponds to our superparticle simulations MspE1. The orange curve is obtained by decreasing the material exclusion distance for the torque evaluation to Rc = 0.1 RH . The green curve is obtained by decreasing the potential smoothing length to zero. The blue curve is obtained by removing superparticles below the critical accretion distance and corresponds to the simulation set MspE0. We point out that the shift from the orange to the green curve is caused by the occurrence of pebble-accreting trajectories (such as those shown in the bottom row of Fig. 3), and therefore, the torque-generating asymmetry of the pebble distribution is already affected by pebble accretion even though superparticles are not yet removed from the simulation (this change is shown by the blue curve).
Current usage metrics show cumulative count of Article Views (full-text article views including HTML views, PDF and ePub downloads, according to the available data) and Abstracts Views on Vision4Press platform.
Data correspond to usage on the plateform after 2015. The current usage metrics is available 48-96 hours after online publication and is updated daily on week days.
Initial download of the metrics may take a while.


