Fig. 3

Download original image
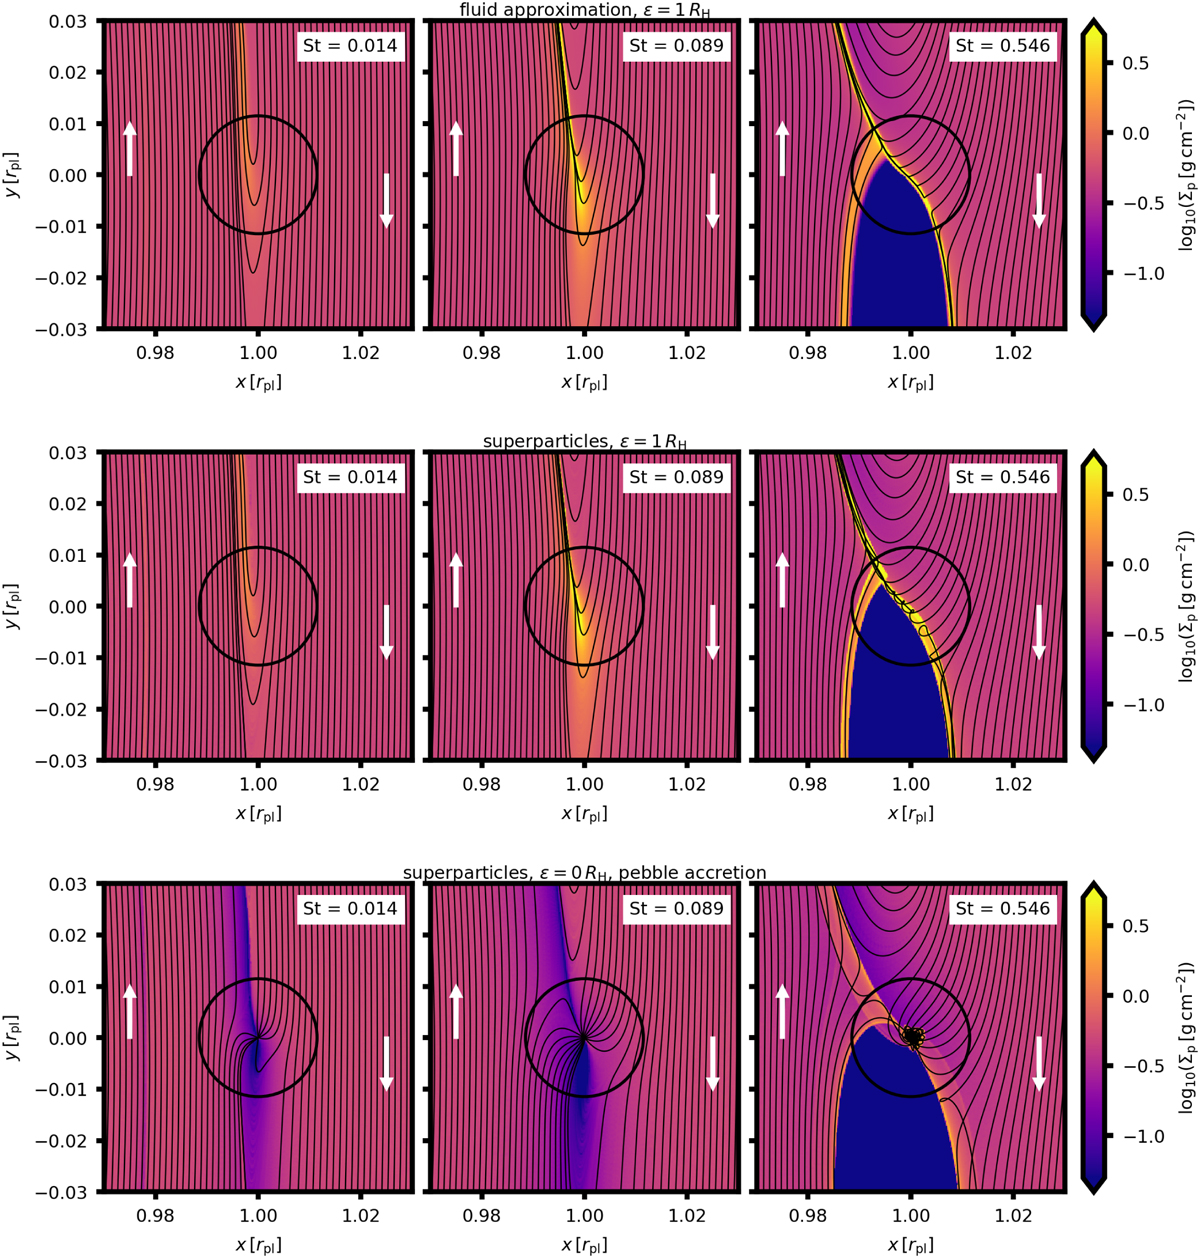
Surface density of pebbles, Σp, near a 1.51 M⊕ planet for three values of the Stokes number: St = 0.014, 0.089, and 0.546 (left, middle, and right columns, respectively). The black circle shows the extent of the Hill radius, and the white arrows show the direction of the shear motion relative to the planet. In an inertial frame, the planet would orbit in the y > 0 direction. Radial drift of pebbles occurs in the x < 0 direction. The lower and upper limits of the logarithmic colour palette correspond to the initial pebble surface density at the planet location multiplied by 10−1 and 101, respectively. Top: Σp results directly from FARGOЗD multi-fluid simulations. The black curves are streamlines of the pebble fluid. The planetary potential smoothing for pebbles is єp = 1 RH, and the simulation time is t = 50 Porb. Middle: Σp calculated from the distribution of superparticles by the cloud-in-cell method and averaged in time. The black curves are trajectories of individual superparticles. The potential smoothing for pebbles is єp = 1 RH, and the simulation time is t = 200 Porb. Bottom: as in the middle row but avoiding potential smoothing for pebbles and allowing for pebble accretion.
Current usage metrics show cumulative count of Article Views (full-text article views including HTML views, PDF and ePub downloads, according to the available data) and Abstracts Views on Vision4Press platform.
Data correspond to usage on the plateform after 2015. The current usage metrics is available 48-96 hours after online publication and is updated daily on week days.
Initial download of the metrics may take a while.


