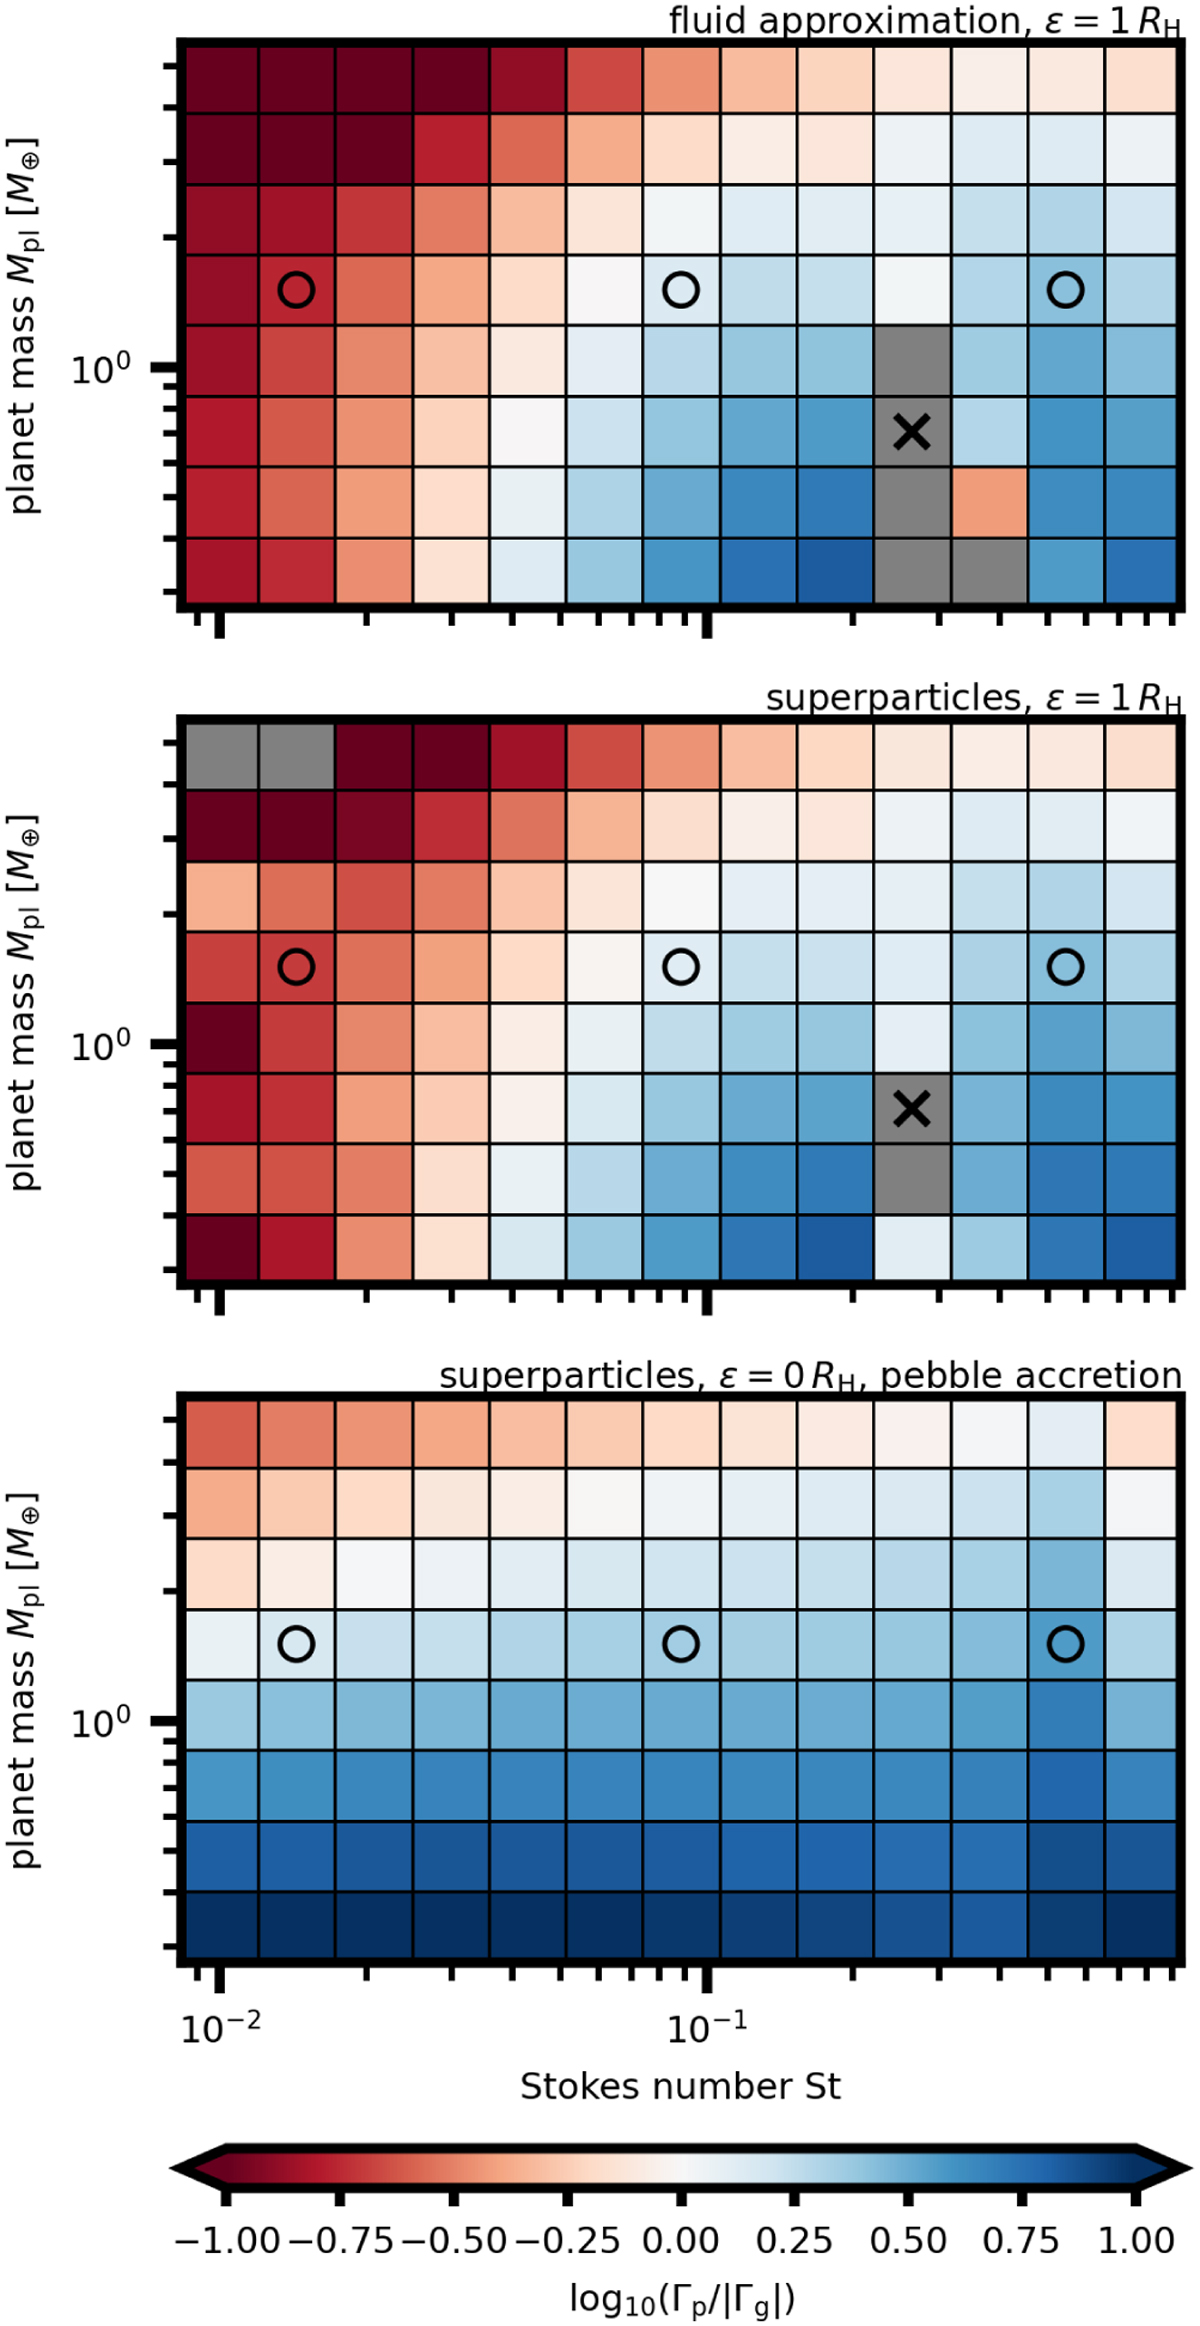
Fig. 2
Download original image
Torque map in the spirit of BLP18 showing the logarithm of the pebble-driven torque, Γp, scaled by the magnitude of the gas-driven torque, |Γg|. Grey patches correspond to parameter combinations for which Γp < 0. Circles mark the simulations that are discussed in detail in Figs. 3 and 4, while crosses mark the simulation analysed in Figs. E.1 and E.2. Top: multi-fluid simulations with FARGO 3D (set MfaE1) using the planetary potential smoothing length є = 1 RH for both gas and pebbles, and the material exclusion radius for the torque calculation Rc = 0.5 RH. Middle: simulations with Lagrangian superparticles representing pebbles (set MspE1). Parameters are the same as in the top panel, except for the time span of 200 orbital periods. Bottom: simulations with Lagrangian superparticles avoiding the potential smoothing for pebbles (set MspE0), Rc = 0.1 RH, and allowing for pebble accretion.
Current usage metrics show cumulative count of Article Views (full-text article views including HTML views, PDF and ePub downloads, according to the available data) and Abstracts Views on Vision4Press platform.
Data correspond to usage on the plateform after 2015. The current usage metrics is available 48-96 hours after online publication and is updated daily on week days.
Initial download of the metrics may take a while.