Fig. E.2
Download original image
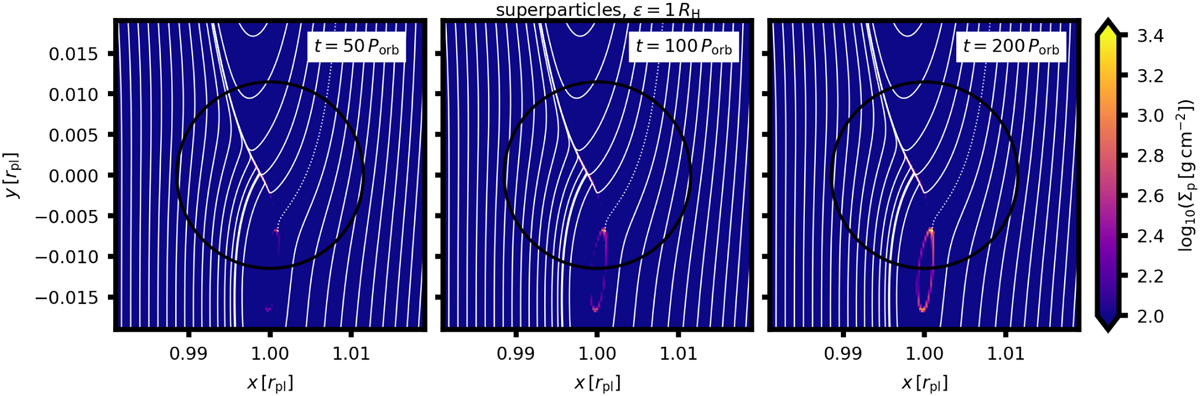
Evolution of the time-averaged surface density, Σp, in the simulation MspE1_M0.7St0.264. The time is given by a label in each panel. The colour palette is saturated in order to highlight how the overdensity of the filament encircling the pebble hole increases in time as more and more pebbles become trapped. A representative trajectory entering the overdense region is shown with a dotted curve and then truncated in order to keep the filament visible. The filament generates a strong negative torque (see Fig. E.1).
Current usage metrics show cumulative count of Article Views (full-text article views including HTML views, PDF and ePub downloads, according to the available data) and Abstracts Views on Vision4Press platform.
Data correspond to usage on the plateform after 2015. The current usage metrics is available 48-96 hours after online publication and is updated daily on week days.
Initial download of the metrics may take a while.