Fig. E.1
Download original image
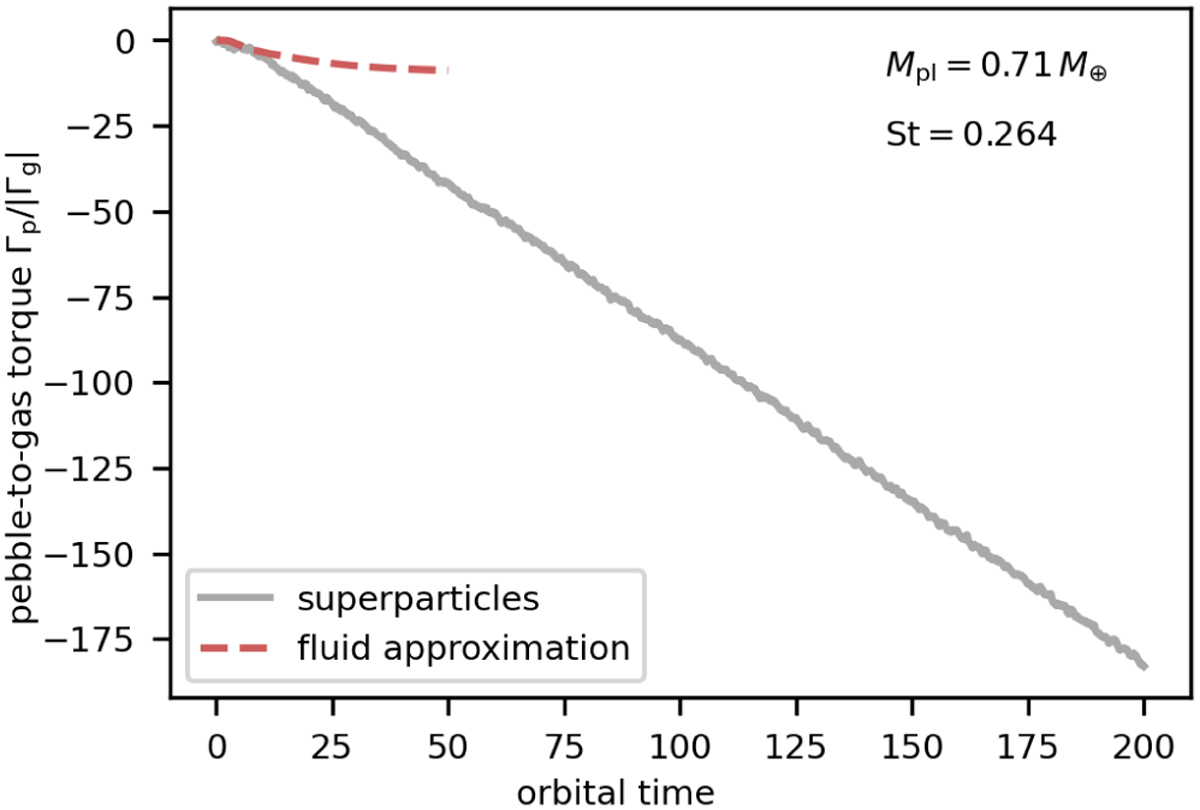
Temporal evolution of the pebble-to-gas torque for simulations MfaE1_M0.7St0.264 (dashed red curve) and MspE1_M0.7St0.264 (grey curve). The linear decrease in the pebble torque is directly related to the accumulation of pebbles in a filament trailing the planet (see Fig. E.2).
Current usage metrics show cumulative count of Article Views (full-text article views including HTML views, PDF and ePub downloads, according to the available data) and Abstracts Views on Vision4Press platform.
Data correspond to usage on the plateform after 2015. The current usage metrics is available 48-96 hours after online publication and is updated daily on week days.
Initial download of the metrics may take a while.