Fig. 1
Download original image
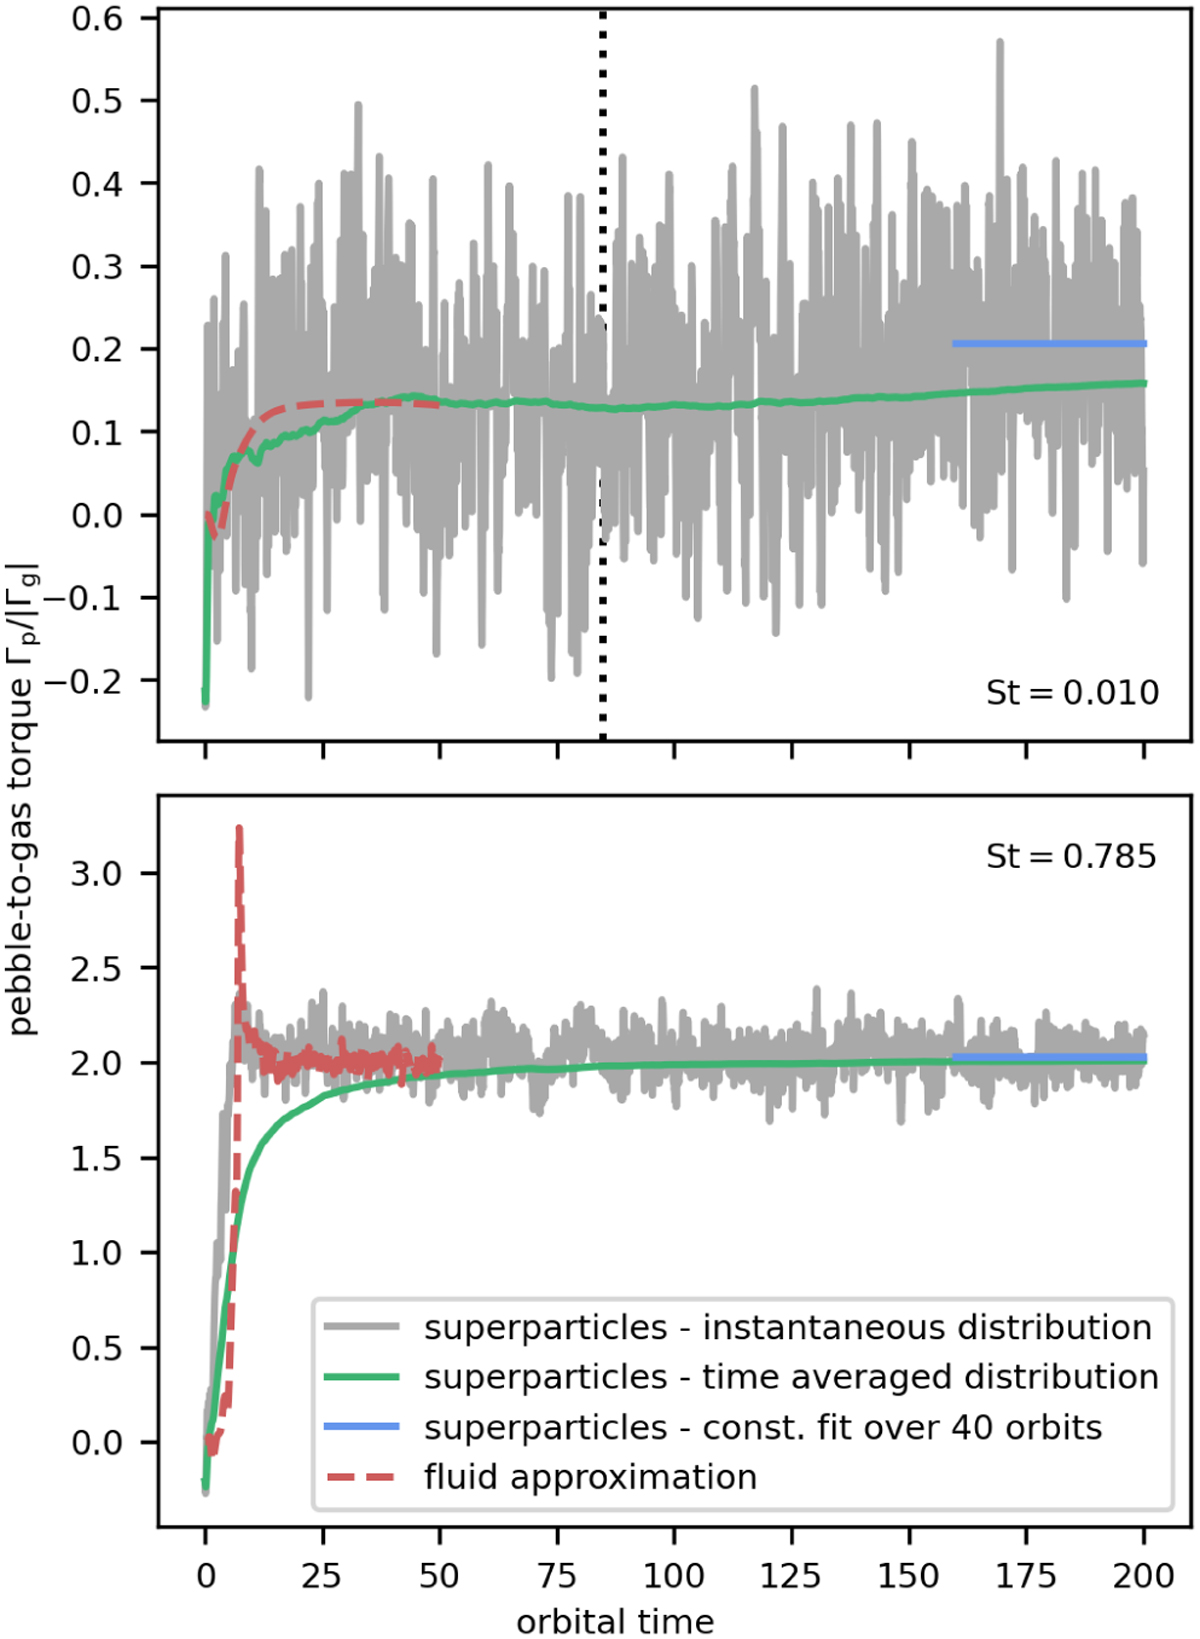
Time evolution of the pebble-to-gas torque ratio, Γp/|Γg|, as a comparison of the fluid and superparticle approximations for the planet mass Mpl = 1.51 M⊕. The Stokes numbers are St = 0.01 (top) and 0.785 (bottom). The planet potential felt by pebbles is smoothed using є = 1RH. The dashed red curve corresponds to simulations obtained with the FARGO 3 D code (set MfaE1). For simulations obtained with the DENEB code (set MspE1,) we distinguish: the torque arising from the instantaneous distribution of superparticles (grey curve), the torque corresponding to the time-averaged superparticle distribution (green curve), and a constant fit of the instantaneous torque (blue line). The dotted vertical line is the approximate time it takes pebbles to radially drift across the horseshoe region of the planet.
Current usage metrics show cumulative count of Article Views (full-text article views including HTML views, PDF and ePub downloads, according to the available data) and Abstracts Views on Vision4Press platform.
Data correspond to usage on the plateform after 2015. The current usage metrics is available 48-96 hours after online publication and is updated daily on week days.
Initial download of the metrics may take a while.