Fig. 5
Download original image
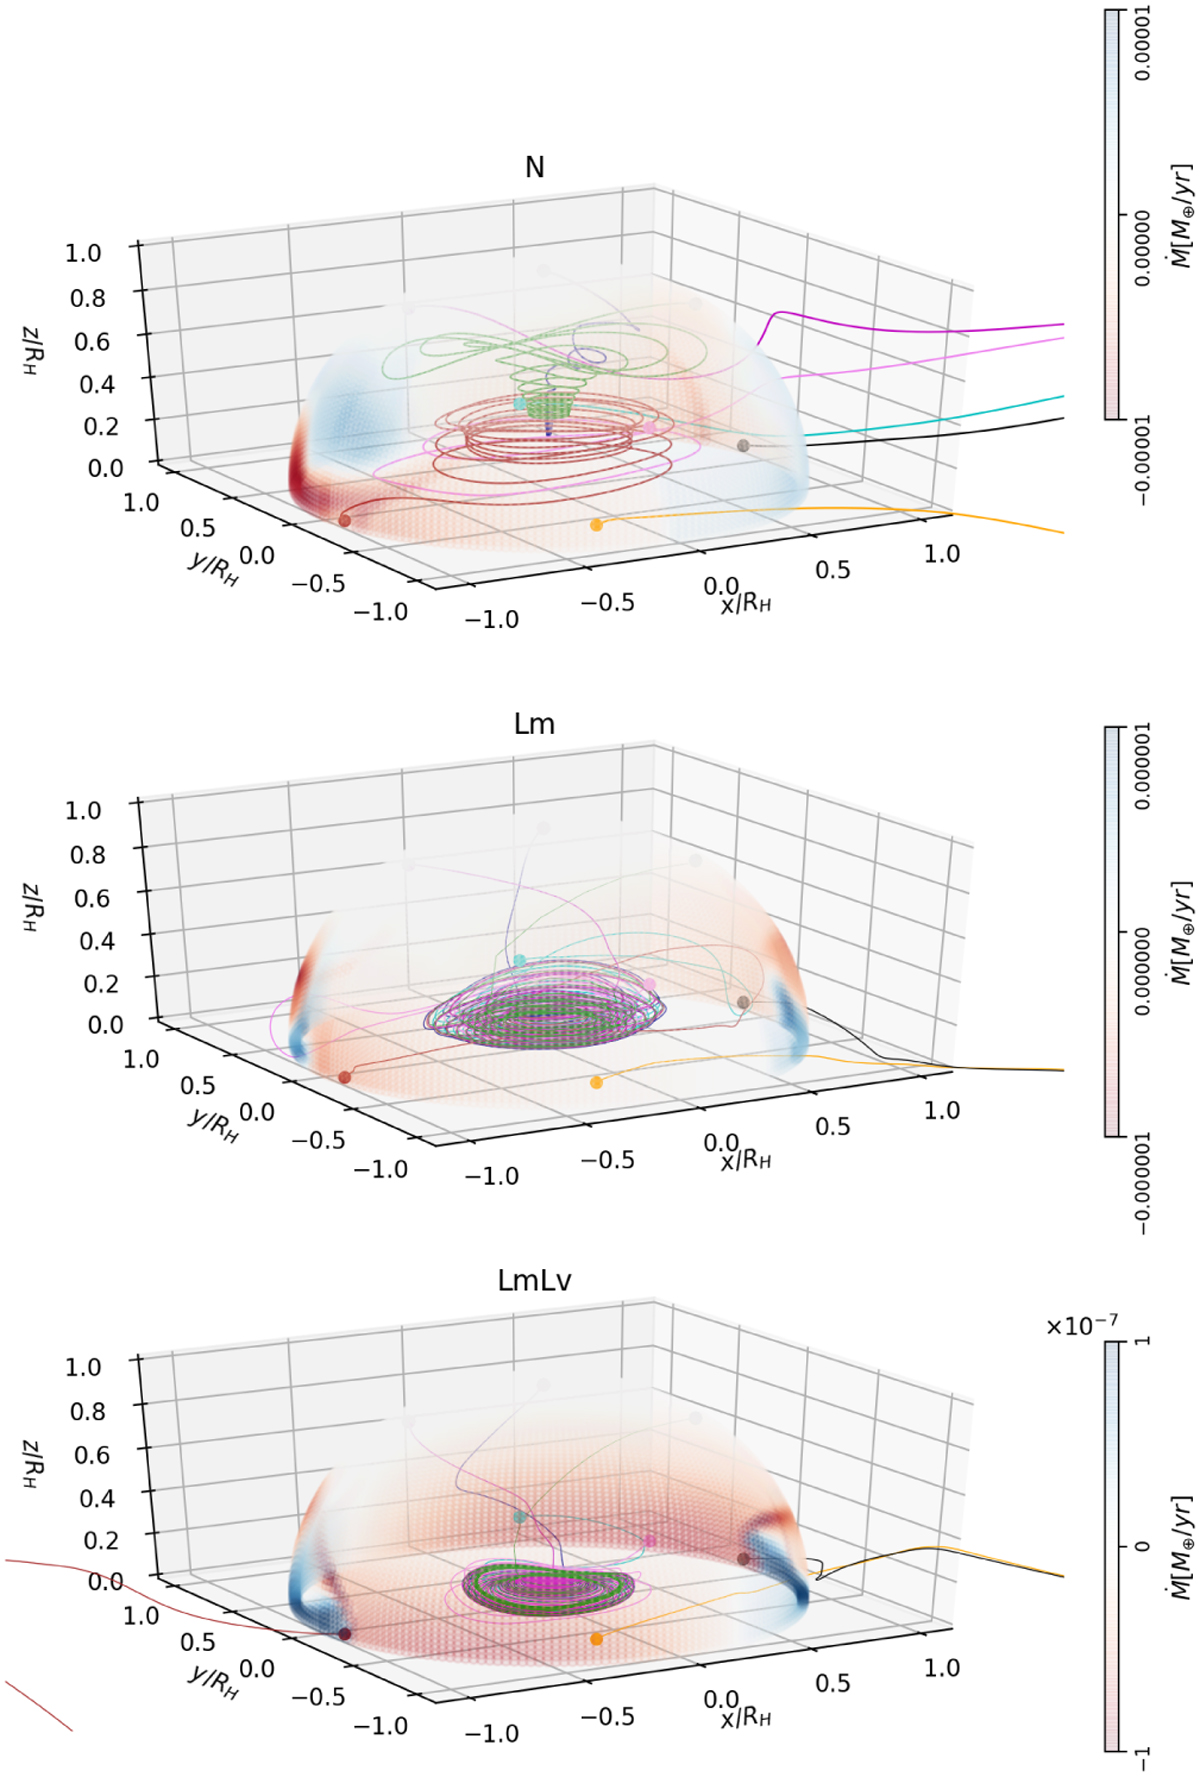
3D representation of streamlines with initial conditions on the Hill sphere (see Table 2). The colour bar corresponds to planeto-centric mass flow rate on the Hill surface. The sign is negative for mass inflow and positive for mass outflow. The total integration time is short (about four Jupiter orbits) in order to make this plot clear. The evolution of the same streamlines on a longer integration allows us to follow the dynamics on a projected plane (x/RH, y/RH) and to appreciate the evolution of the distance with respect to the planet in Fig. 6.
Current usage metrics show cumulative count of Article Views (full-text article views including HTML views, PDF and ePub downloads, according to the available data) and Abstracts Views on Vision4Press platform.
Data correspond to usage on the plateform after 2015. The current usage metrics is available 48-96 hours after online publication and is updated daily on week days.
Initial download of the metrics may take a while.