Fig. 3
Download original image
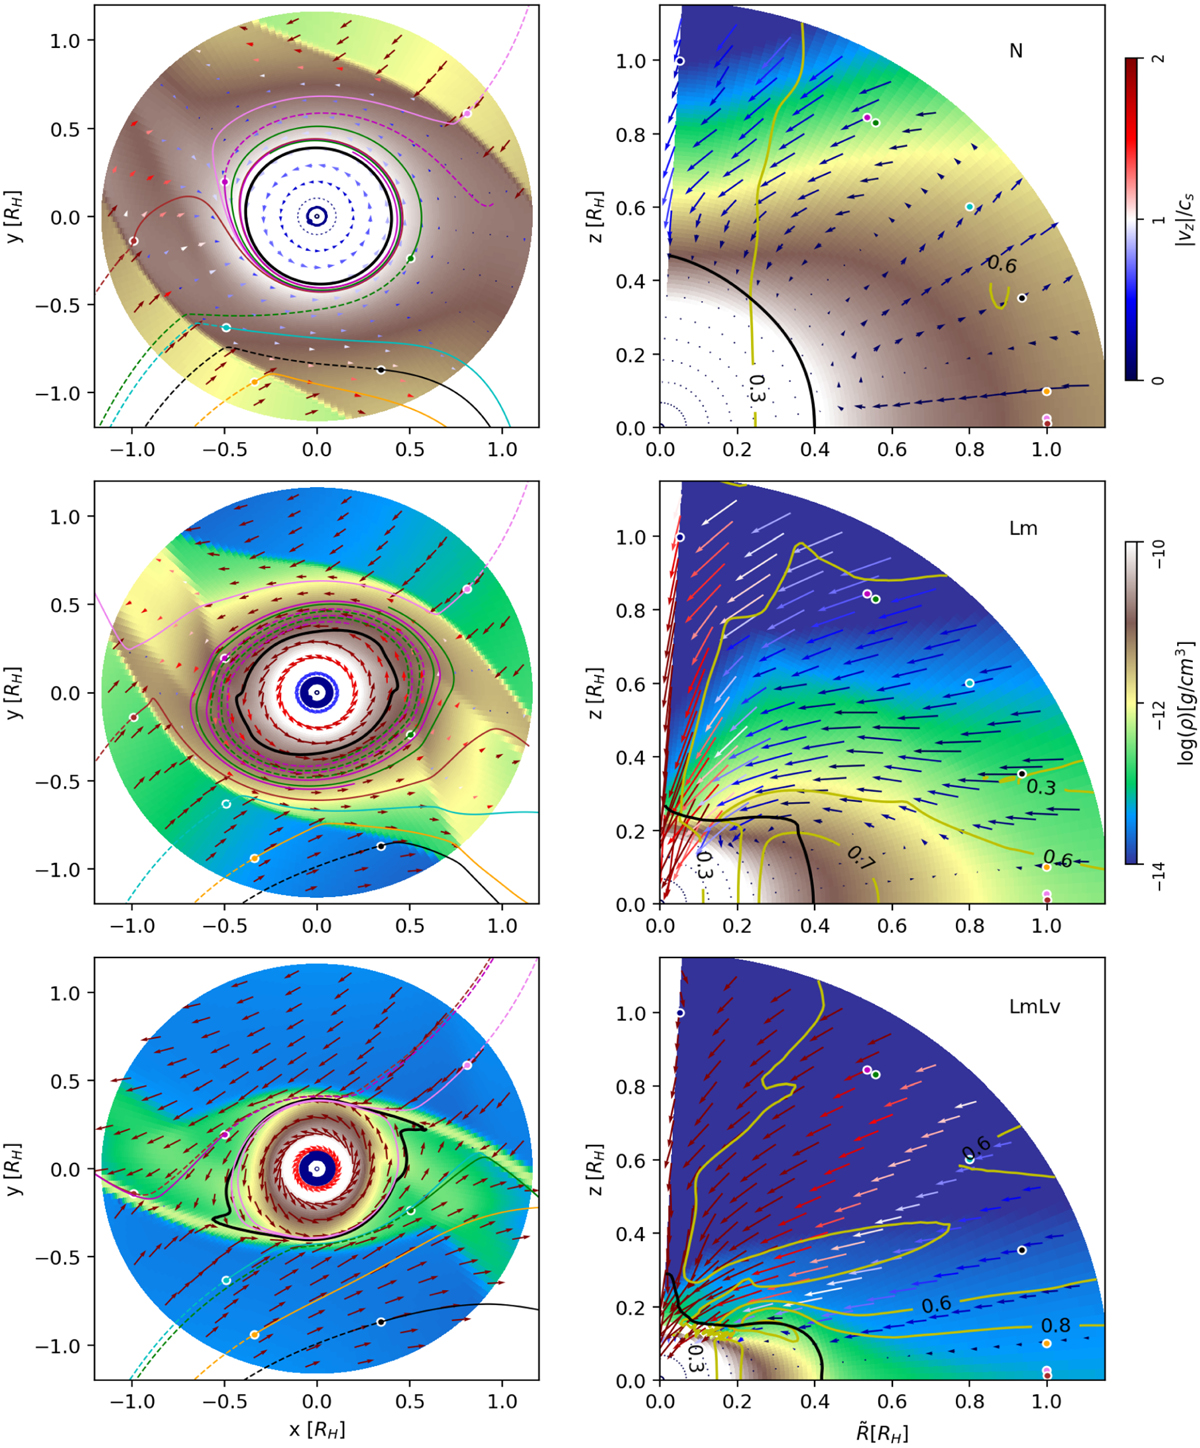
Parameter details for all three models. Left: midplane density field interpolated in cartesian planeto-centric coordinates(x, y) = (R cos(ϕ), R sin(ϕ)) in units of the Hill radius). The cartesian components (υx, υy) of the midplane velocity field are plotted with arrows. The coloured lines are straightforward (full) and backward (dashed) integration of streamlines obtained with the 2D midplane velocity field. Right: azimuthally averaged density field interpolated in planeto-centric coordinates and represented in ![]() plane. The azimuthally averaged and density weighted velocity is represented with arrows. The colours of the arrows correspond to values of the of the gas speed normalised over the sound speed(respectively the midplane speed (left column) and the absolute value of υz (right column)). The yellow contour levels correspond to the vertical component of the angular momentum in units of the Keplerian momentum with respect to the planet. The coloured markers give the initial conditions for the streamlines of Table 2, projected on the (x, y) and (
plane. The azimuthally averaged and density weighted velocity is represented with arrows. The colours of the arrows correspond to values of the of the gas speed normalised over the sound speed(respectively the midplane speed (left column) and the absolute value of υz (right column)). The yellow contour levels correspond to the vertical component of the angular momentum in units of the Keplerian momentum with respect to the planet. The coloured markers give the initial conditions for the streamlines of Table 2, projected on the (x, y) and (![]() , z) planes, respectively, and the black solid lines identify the 0 energy contour (see Eq. (4)).
, z) planes, respectively, and the black solid lines identify the 0 energy contour (see Eq. (4)).
Current usage metrics show cumulative count of Article Views (full-text article views including HTML views, PDF and ePub downloads, according to the available data) and Abstracts Views on Vision4Press platform.
Data correspond to usage on the plateform after 2015. The current usage metrics is available 48-96 hours after online publication and is updated daily on week days.
Initial download of the metrics may take a while.