Fig. 1
Download original image
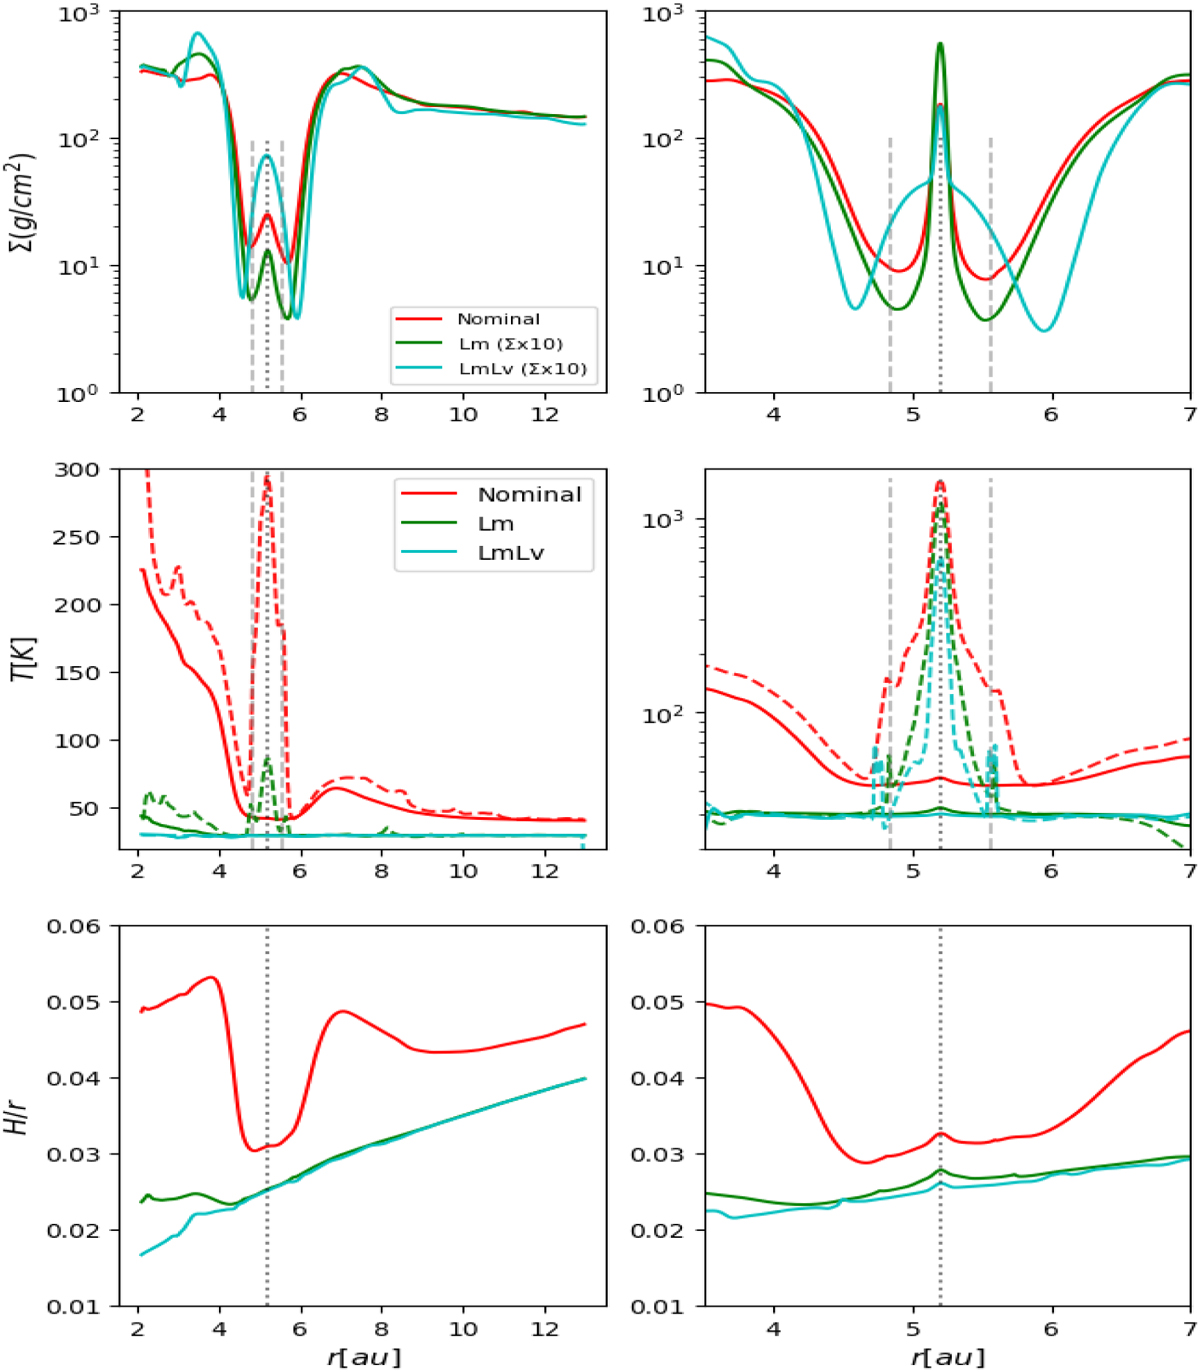
Radial density profiles (top), azimuthally and vertically averaged temperature (middle), and disk aspect ratio (bottom) profiles for the three models at the end of phase A (left) and C (right). The grey dashed lines indicate the boundary of the Hill sphere and the black dotted line the position of the planet. The density of the Lm and LmLv cases has been multiplied by 10 in order to superpose the density background and appreciate the differences in the gap’s depth and width. We notice that in the LmLv case a large amount of gas is accumulated in a radial domain corresponding to the Hill sphere. This is not gas accumulated around the planet but it is the signature of the libration region around the L4 and L5 Lagrangian points not being depleted yet (a known fact in the case of low-viscosity disks). In the middle panel, the midplane temperature is over-plotted with same colours (dashed) on a slice at the planet’s azimuth φ = 0. The higher resolution associated with the deepening of the potential (decreasing smoothing) results in a huge temperature increase up to [1600, 1100, 600] K in the nominal model, the Lm case, and the LmLv model, respectively. In the bottom panel, we remark that it is only in the nominal case that the formation of the gap modifies the aspect ratio considerably.
Current usage metrics show cumulative count of Article Views (full-text article views including HTML views, PDF and ePub downloads, according to the available data) and Abstracts Views on Vision4Press platform.
Data correspond to usage on the plateform after 2015. The current usage metrics is available 48-96 hours after online publication and is updated daily on week days.
Initial download of the metrics may take a while.