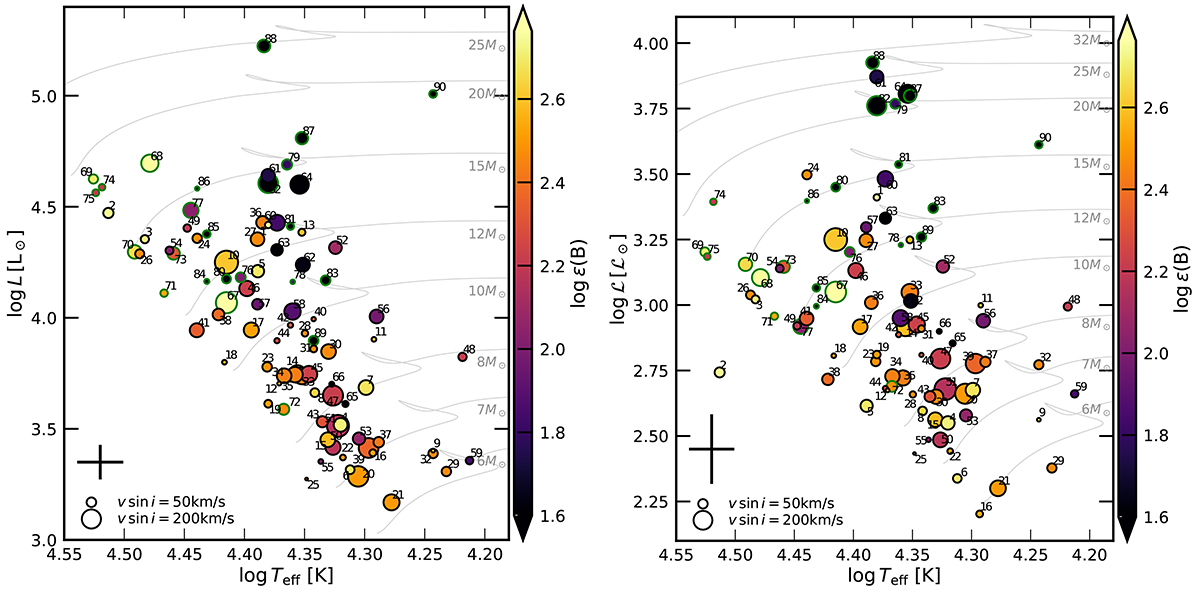
Fig. 8.
Download original image
Stars in our dataset on the HRD (left) and sHRD (right). The size of the circles is proportional to the projected rotational velocity of each star. The inner color of the circles corresponds to the measured surface boron abundance (stars 1…66), and stars upper limits on the boron abundance (stars 67…90) are marked by circles with a green edge. Evolutionary tracks of non-rotating single star models are also shown. The crosses in the lower left corners show the typical errors in the observed quantities.
Current usage metrics show cumulative count of Article Views (full-text article views including HTML views, PDF and ePub downloads, according to the available data) and Abstracts Views on Vision4Press platform.
Data correspond to usage on the plateform after 2015. The current usage metrics is available 48-96 hours after online publication and is updated daily on week days.
Initial download of the metrics may take a while.