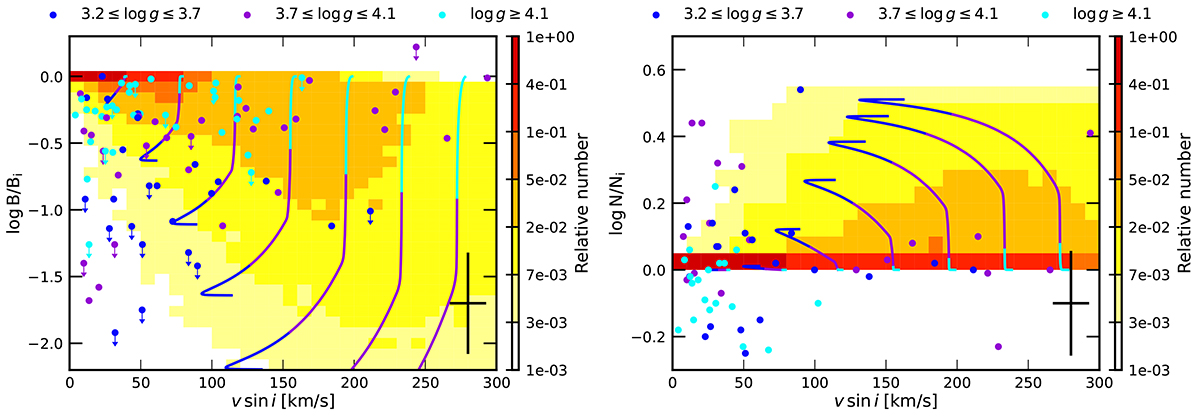
Fig. 6.
Download original image
Surface abundances as a function of projected rotational velocity (dubbed Hunter diagram; Hunter et al. 2008b) for the boron depletion factor (left) and for the nitrogen enhancement factor (right). The background contour is the predicted number distribution from a single star model population of early B-type main sequence stars, which is based on the Salpeter (1955) initial mass function for Mi = 5 − 20 M⊙ stars, the rotational velocity distribution from Dufton et al. (2013), and a constant star formation rate. The color indicates the relative number of models in each bin, normalized to the maximum value in each panel. Evolutionary tracks for 12 M⊙ stars with different initial rotational velocities are shown, whose surface rotational velocities are multiplied by π/4. The crosses in the lower right corners show the typical errors in the observed quantities. See Brott et al. (2011b) for the LMC metallicity counterpart for the Hunter diagram for nitrogen.
Current usage metrics show cumulative count of Article Views (full-text article views including HTML views, PDF and ePub downloads, according to the available data) and Abstracts Views on Vision4Press platform.
Data correspond to usage on the plateform after 2015. The current usage metrics is available 48-96 hours after online publication and is updated daily on week days.
Initial download of the metrics may take a while.