Fig. D.1.
Download original image
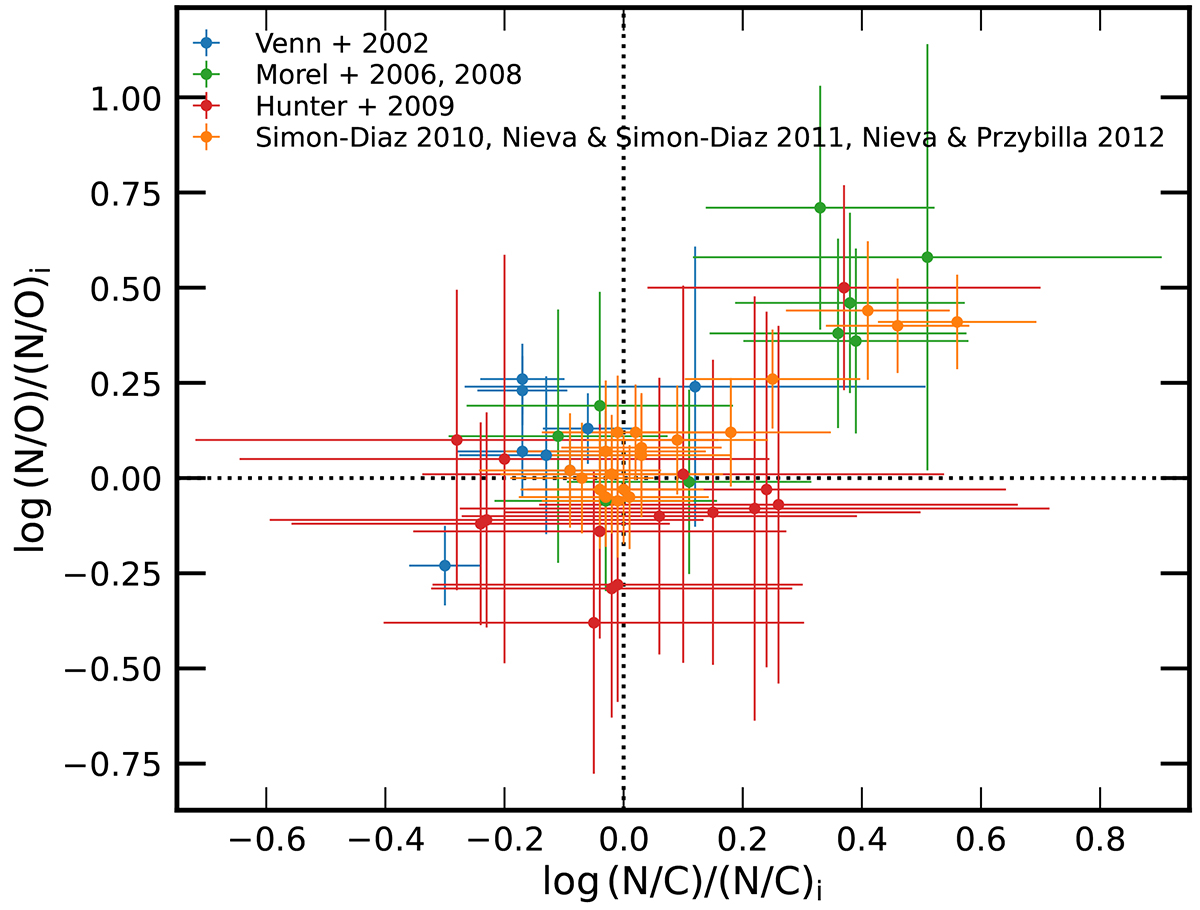
Nitrogen enhancement factors of the stars, defined as nitrogen abundance over carbon abundance (x-axis) and oxygen abundance (y-axis) with respect to their initial values (see Table 2). The error bars show the original Δlog(N/C)/(N/C)_i and Δlog(N/C)/(N/C)_i before adopting the maximum of 0.4 dex, or the original values as the uncertainties. Each data point is color-coded based on the reference from which the surface carbon, nitrogen, and oxygen abundance are obtained. The black dotted lines show the baselines of no nitrogen enhancement.
Current usage metrics show cumulative count of Article Views (full-text article views including HTML views, PDF and ePub downloads, according to the available data) and Abstracts Views on Vision4Press platform.
Data correspond to usage on the plateform after 2015. The current usage metrics is available 48-96 hours after online publication and is updated daily on week days.
Initial download of the metrics may take a while.