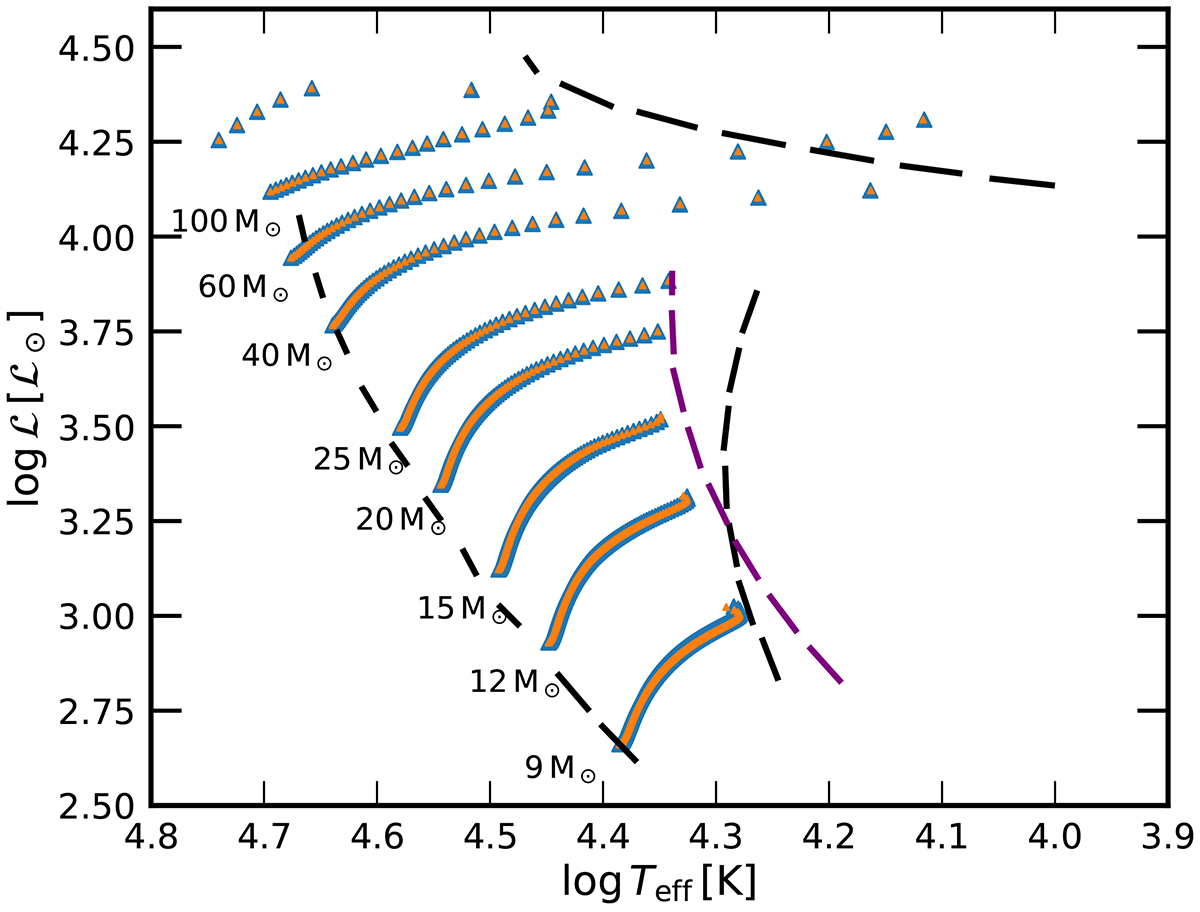
Fig. B.2.
Download original image
Main sequence evolutionary tracks of single star models computed with basic network (blue triangles) and STERN network (yellow triangles) on the spectroscopic Hertzsprung-Russel diagram. Along each track, data points are separated by a time interval of 0.1 Myr. The black dashed lines show the boundaries of a region that is densely populated by Galactic stars, and the purple dashed line corresponds to the terminal age main sequence (terminal-age main sequence) line of the Galactic models of Brott et al. (2011a) (see fig. 1 in Castro et al. (2014)).
Current usage metrics show cumulative count of Article Views (full-text article views including HTML views, PDF and ePub downloads, according to the available data) and Abstracts Views on Vision4Press platform.
Data correspond to usage on the plateform after 2015. The current usage metrics is available 48-96 hours after online publication and is updated daily on week days.
Initial download of the metrics may take a while.