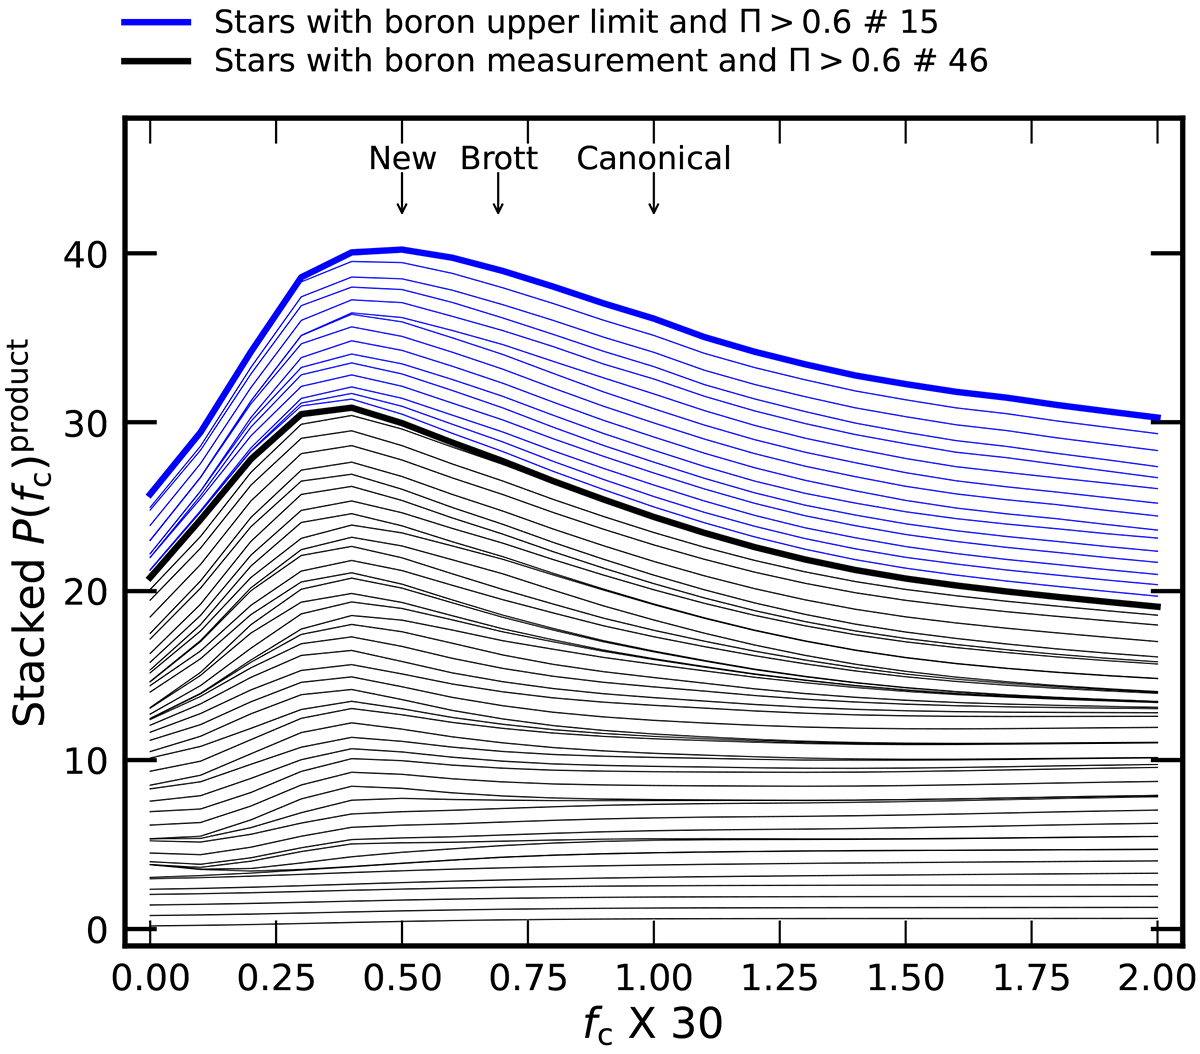
Fig. 14.
Download original image
Stacked P(fc)product distributions for the stars belonging to high Π group (Π > 0.6). The distributions of stars with boron measurement (upper limit) are shown in the black (blue) lines. The arrows at the top indicate the canonical value from Chaboyer & Zahn (1992), the preferred value by Brott et al. (2011a), and the new preferred value by this work.
Current usage metrics show cumulative count of Article Views (full-text article views including HTML views, PDF and ePub downloads, according to the available data) and Abstracts Views on Vision4Press platform.
Data correspond to usage on the plateform after 2015. The current usage metrics is available 48-96 hours after online publication and is updated daily on week days.
Initial download of the metrics may take a while.