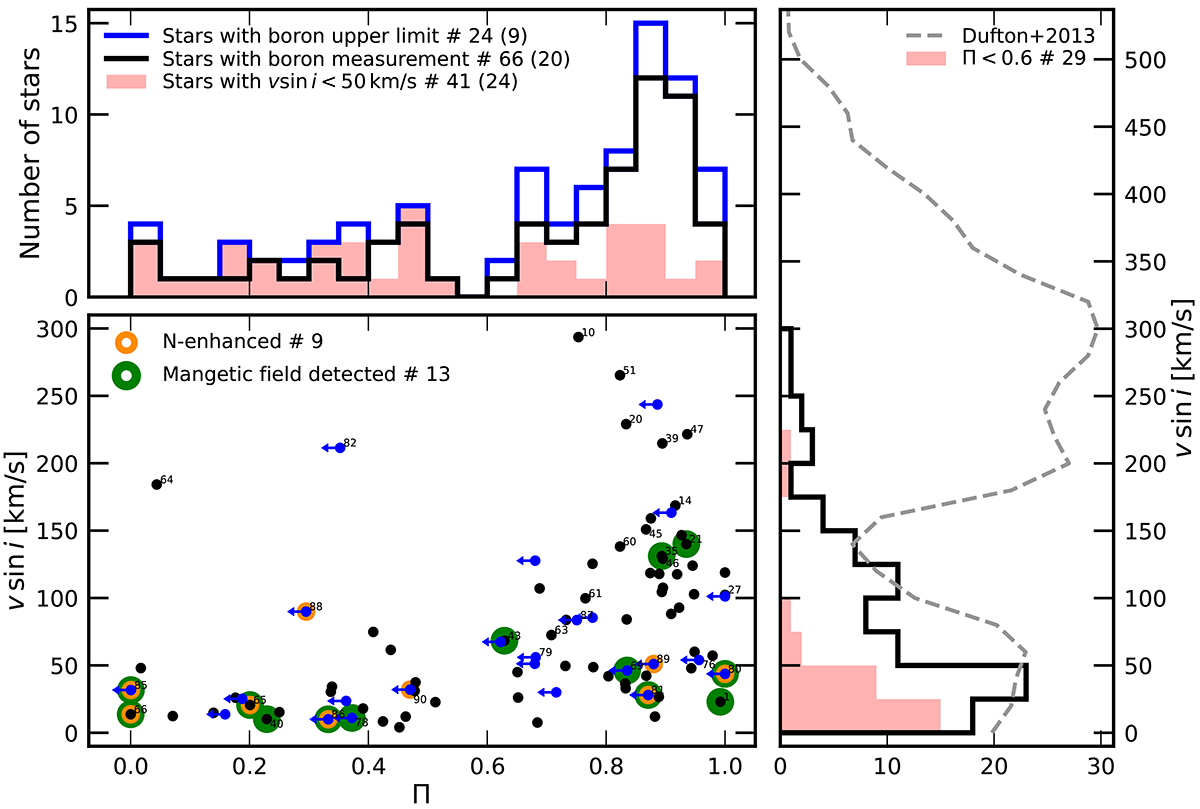
Fig. 13.
Download original image
Result of our Bayesian analysis for the stars in our dataset. Lower left: Stars with boron upper limit (blue circles with leftward arrows) and the stars with boron measurement (black circles) in the v sin i versus Π diagram. Stars with a clear sign of nitrogen enhancement are marked with a yellow edge, and stars with magnetic field detection are marked with a green edge (see text). Stellar numbers are shown if a star is nitrogen enhanced, magnetic field detected, or a member of NGC 3293. Four stars (Star 15, 27, 70, 80) showing Π or the upper limit on Π larger than 1.0 are placed at Π = 1.0 for better visibility. Upper left: Distribution of Π of stars with boron upper limit (blue) and boron measurement (black). The results are stacked. The distribution corresponding to slow rotators (v sin i < 50 km s−1) is shown in red. The numbers corresponding to each group are presented in the legend, and the numbers in parentheses are the number of stars with Π < 0.6 in each group. Lower right: Distribution of v sin i of stars. The distribution corresponding to the low Π group (Π < 0.6) is shown in red. The number of corresponding stars is shown in the legend.
Current usage metrics show cumulative count of Article Views (full-text article views including HTML views, PDF and ePub downloads, according to the available data) and Abstracts Views on Vision4Press platform.
Data correspond to usage on the plateform after 2015. The current usage metrics is available 48-96 hours after online publication and is updated daily on week days.
Initial download of the metrics may take a while.