Fig. 4.
Download original image
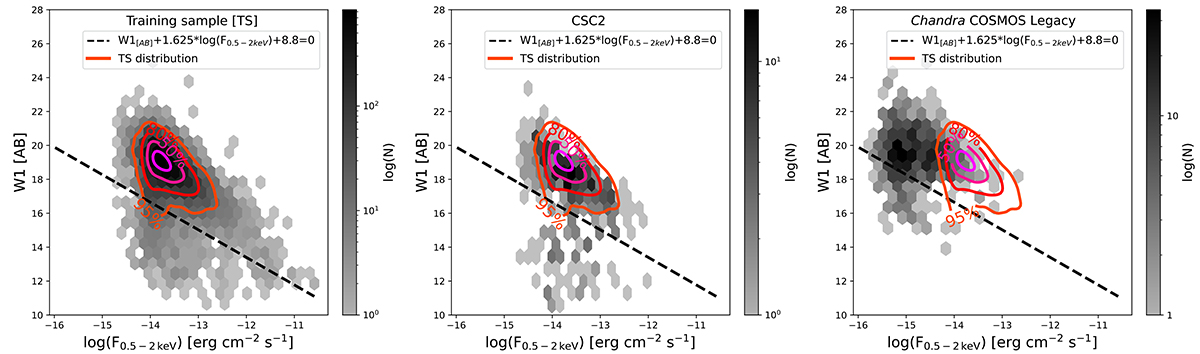
X-rays flux vs. W1 magnitude distributions for the training (left panel) and the blind samples: CSC2 (middle panel) and Chandra-COSMOS (right panel). The dashed line represents the galactic/extragalactic separation proposed in Salvato et al. (2018b), who already pointed out that bright nearby galaxies would be misclassified. The contours encompassing 50%, 80%, and 95% of the training sample distribution are over-plotted on all panels. While the CSC2 sample has a distribution similar to the training sample, the distribution of the Chandra-COSMOS Legacy sources is biased toward fainter values of X-rays and W1.
Current usage metrics show cumulative count of Article Views (full-text article views including HTML views, PDF and ePub downloads, according to the available data) and Abstracts Views on Vision4Press platform.
Data correspond to usage on the plateform after 2015. The current usage metrics is available 48-96 hours after online publication and is updated daily on week days.
Initial download of the metrics may take a while.