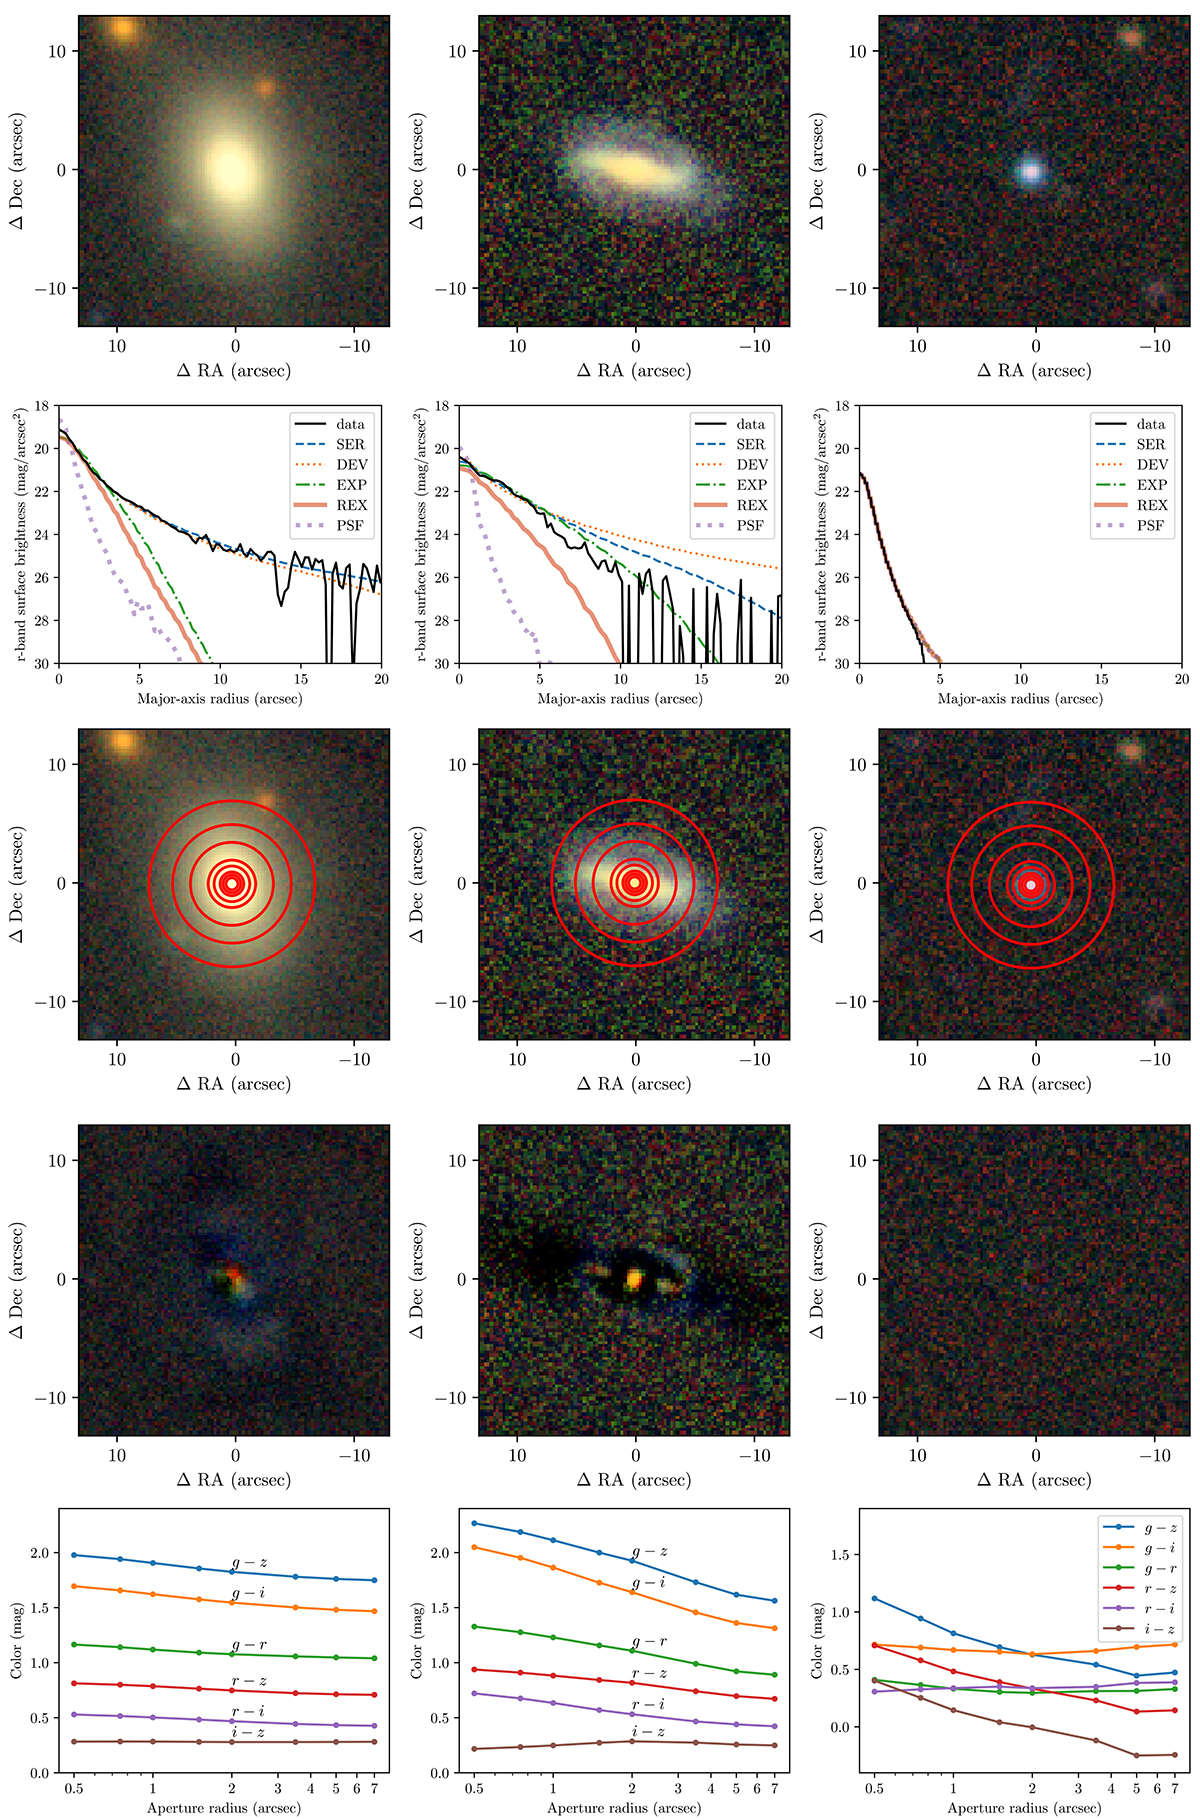
Fig. 2.
Download original image
Optical RGB image (top) of an inactive galaxy (left) and a low-redshift X-ray detected AGN (middle) and a QSO (right). Second row: Azimuth profile of the sources, with over-plotted available model profiles (PSF, REX, EXP, DEV, and SER). Third row: Apertures within which ap_flux[band] is measured. Fourth row: the residual image after subtracting the best model. Bottom row shows, within each aperture, all the colors computed; the figures show how the profiles of the colors change with the distance from the center, depending on the source type (see more details in the main text).
Current usage metrics show cumulative count of Article Views (full-text article views including HTML views, PDF and ePub downloads, according to the available data) and Abstracts Views on Vision4Press platform.
Data correspond to usage on the plateform after 2015. The current usage metrics is available 48-96 hours after online publication and is updated daily on week days.
Initial download of the metrics may take a while.