Fig. 5
Download original image
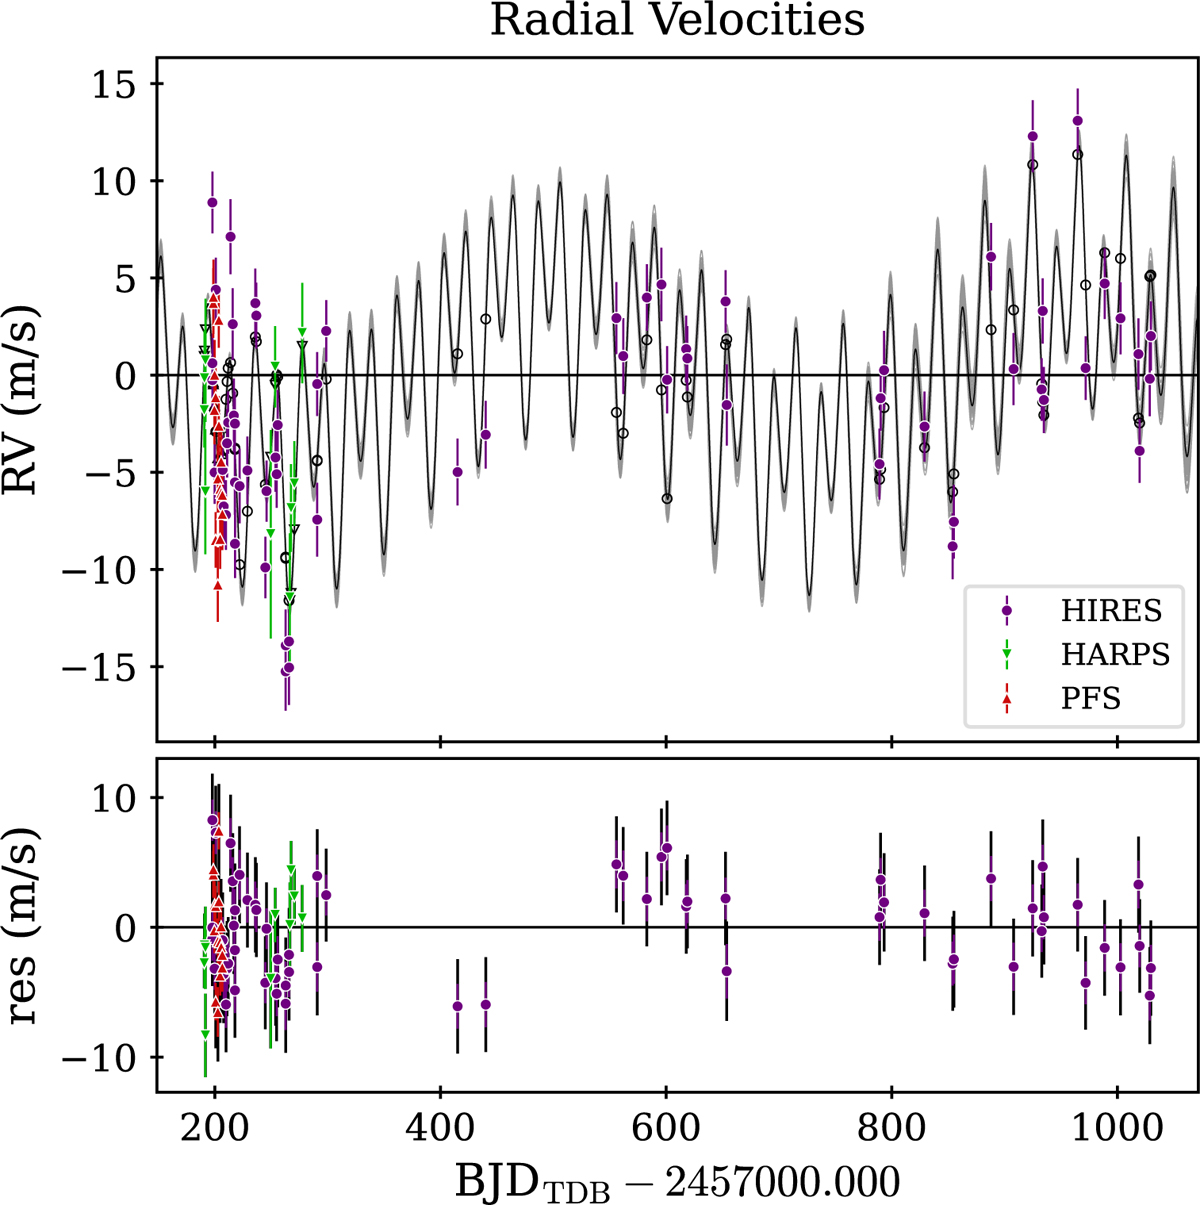
Radial velocities of K2-24. Upper panel: RV plot; each data set (HIRES, HARPS, PFS) is plotted with a different marker shape and color, as in legend. The MAP RV model from the best-fit TRADES orbital solution is plotted as a black line, while the RV points computed at the observed epochs are rendered with open black circles. Samples drawn from the posterior distribution within HDI are shown as gray lines. Lower panel: RV residuals with respect to the TRADES RV best-fit model. The corresponding jitter determined from the best-fit model has been added in quadrature to the measured uncertainty of each data point.
Current usage metrics show cumulative count of Article Views (full-text article views including HTML views, PDF and ePub downloads, according to the available data) and Abstracts Views on Vision4Press platform.
Data correspond to usage on the plateform after 2015. The current usage metrics is available 48-96 hours after online publication and is updated daily on week days.
Initial download of the metrics may take a while.