Fig. 4
Download original image
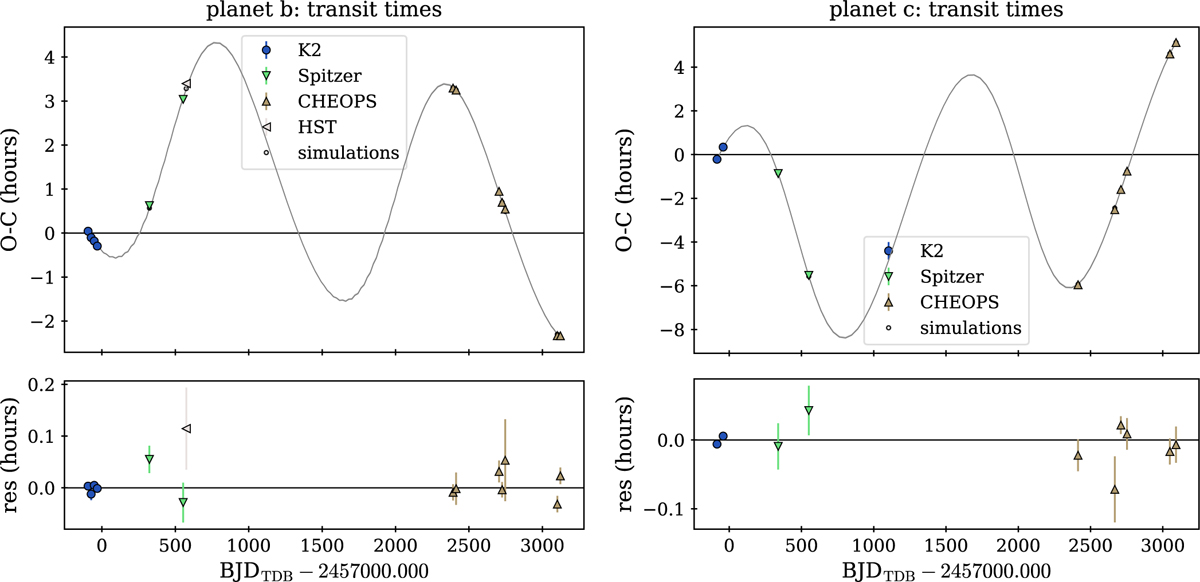
TTV modeling of K2-24b (left panels) and K2-24c (right panels). Top panel: (O – C) diagram, calculated by subtracting the T0 predicted by the linear ephemeris to the observed transit times (K2, Spitzer, HST, CHEOPS). The O – C values computed from the observed T0s are plotted with different solid colors and marker shapes, while the O – C values computed at the same epochs by the best-fit TRADES dynamical model (Section 4) are plotted as black open circles. Samples drawn from the posterior distribution from TRADES within HDI are shown as gray lines. Bottom panel: Residuals computed as the difference between observed and simulated T0s.
Current usage metrics show cumulative count of Article Views (full-text article views including HTML views, PDF and ePub downloads, according to the available data) and Abstracts Views on Vision4Press platform.
Data correspond to usage on the plateform after 2015. The current usage metrics is available 48-96 hours after online publication and is updated daily on week days.
Initial download of the metrics may take a while.