Open Access
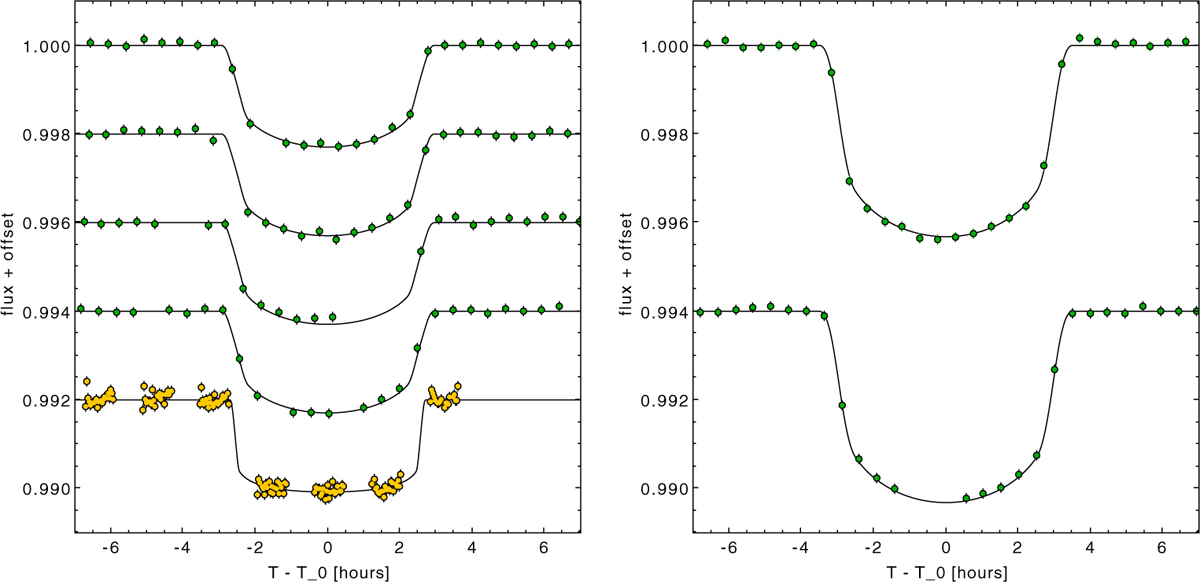
Fig. A.3
Download original image
Light curves of K2-24b (left panel) and K2-24c (right panel) from K2 (green circles) and HST/WFC3 (yellow circles) analyzed for the present work (Section 2.1 and 2.2). The light curves are sorted in chronological order from top to bottom, as in Table 3. An arbitrary vertical offset was added for visualization.
Current usage metrics show cumulative count of Article Views (full-text article views including HTML views, PDF and ePub downloads, according to the available data) and Abstracts Views on Vision4Press platform.
Data correspond to usage on the plateform after 2015. The current usage metrics is available 48-96 hours after online publication and is updated daily on week days.
Initial download of the metrics may take a while.