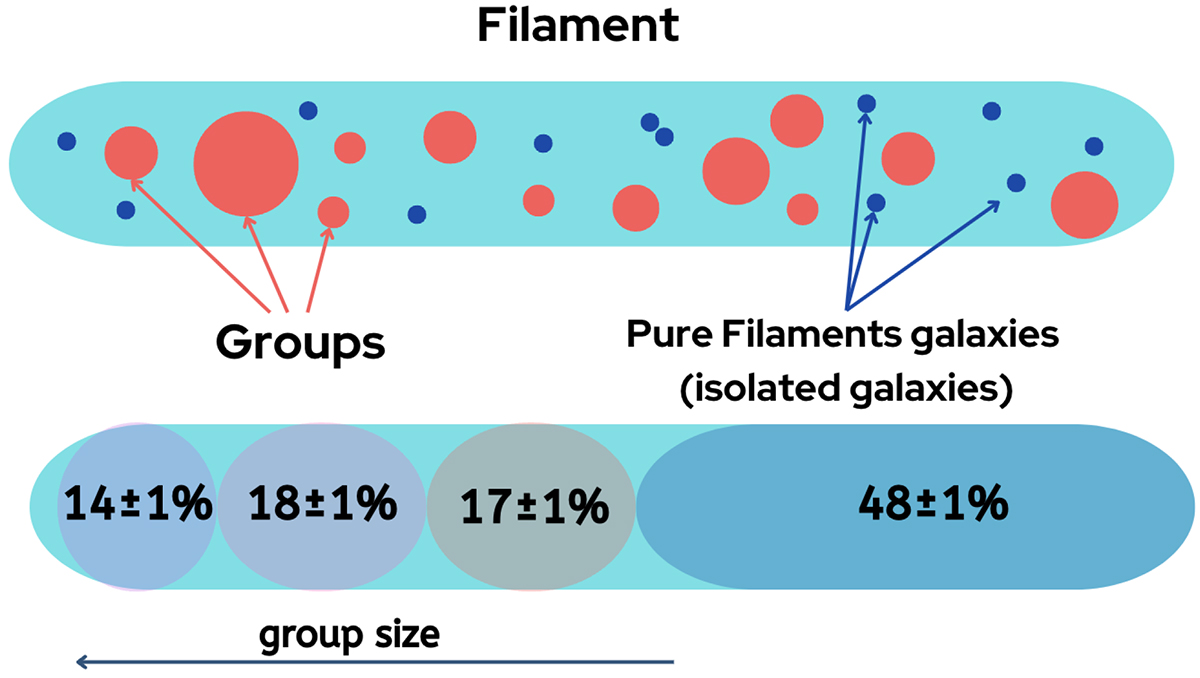
Fig. 9.
Download original image
Schematic representation of filament composition by galaxies in groups of different sizes and pure filament galaxies (i.e. alone in their halo; top panel). The proportion of galaxies in groups with 15 < Nmem < 50, 5 < Nmem < 15, and 1 < Nmem < 5 members and pure filament in total filaments population, respectively (bottom panel), taking into account the selection function.
Current usage metrics show cumulative count of Article Views (full-text article views including HTML views, PDF and ePub downloads, according to the available data) and Abstracts Views on Vision4Press platform.
Data correspond to usage on the plateform after 2015. The current usage metrics is available 48-96 hours after online publication and is updated daily on week days.
Initial download of the metrics may take a while.