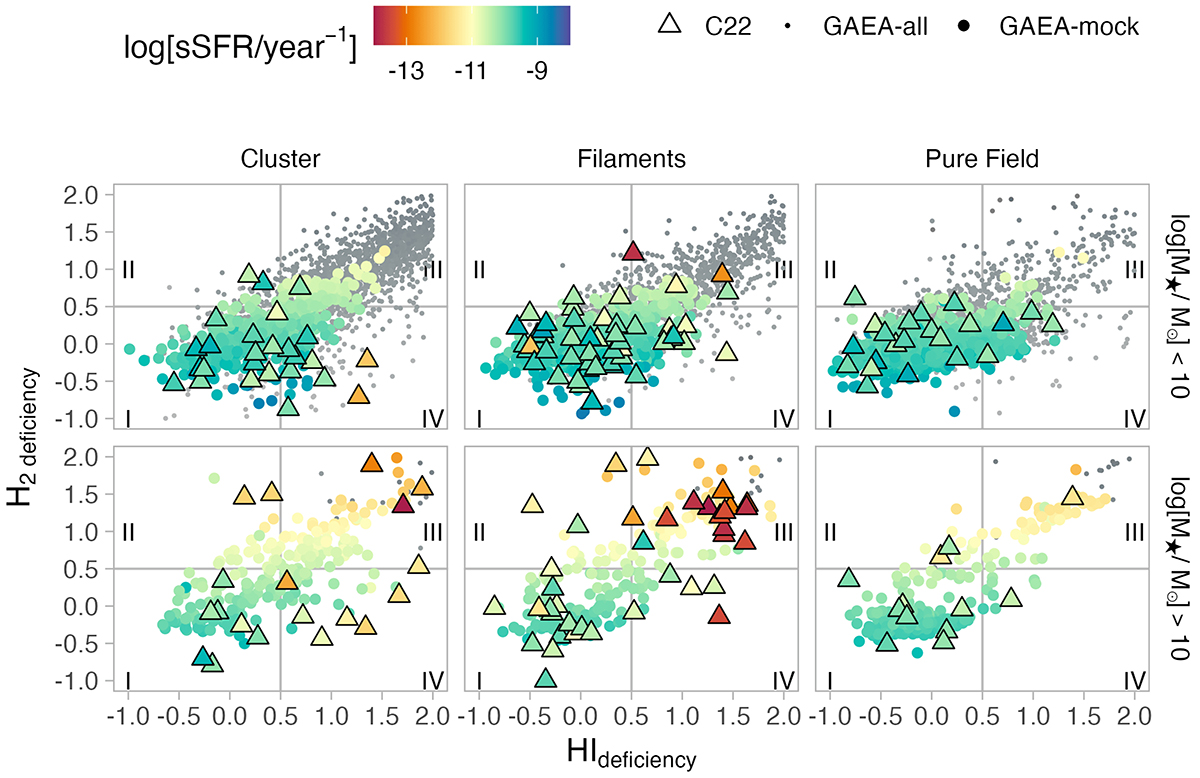
Fig. 8.
Download original image
H2, deficiency–HIdeficiency relations for low-mass (top) and massive (bottom) galaxies in clusters (left), filaments (middle), and the pure field (right). GAEA-mock data is represented by big circles, GAEA-all data by small circles, and C22 data by triangles. Each point of the GAEA-mock/C22 is coloured by sSFR. The vertical and horizontal lines show 0.5 dex deficiency levels used to separate gas normal from gas deficient galaxies.
Current usage metrics show cumulative count of Article Views (full-text article views including HTML views, PDF and ePub downloads, according to the available data) and Abstracts Views on Vision4Press platform.
Data correspond to usage on the plateform after 2015. The current usage metrics is available 48-96 hours after online publication and is updated daily on week days.
Initial download of the metrics may take a while.