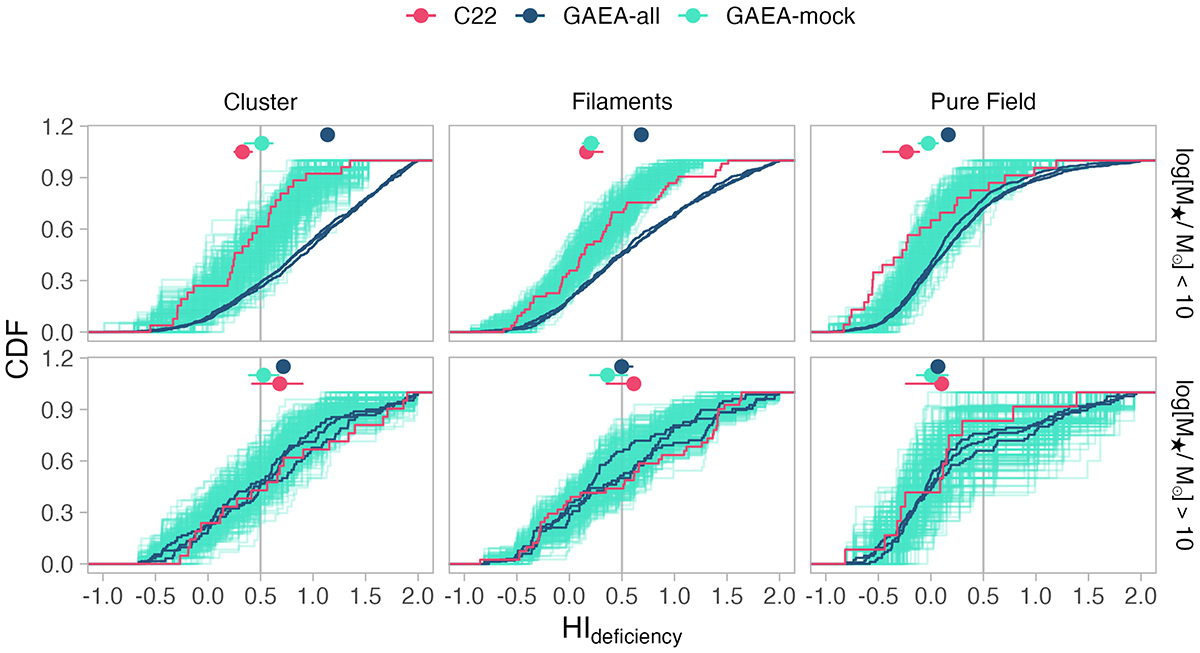
Fig. 5.
Download original image
HI-deficiency cumulative distribution function for GAEA-all (three lines for GAEA-all V1, GAEA-all V2 and GAEA-all V3); GAEA-mock (300 lines); and C22 split into the different environments and two mass bins (low-mass log10[M⋆/M⊙]< 10 and massive galaxies log10[M⋆/M⊙]> 10). In each plot, the median values with a 1σ confidential interval are reported. The grey vertical line shows the 0.5 HI-deficiency level as a level adopted to consider a galaxy as HI-deficient.
Current usage metrics show cumulative count of Article Views (full-text article views including HTML views, PDF and ePub downloads, according to the available data) and Abstracts Views on Vision4Press platform.
Data correspond to usage on the plateform after 2015. The current usage metrics is available 48-96 hours after online publication and is updated daily on week days.
Initial download of the metrics may take a while.