Fig. 4.
Download original image
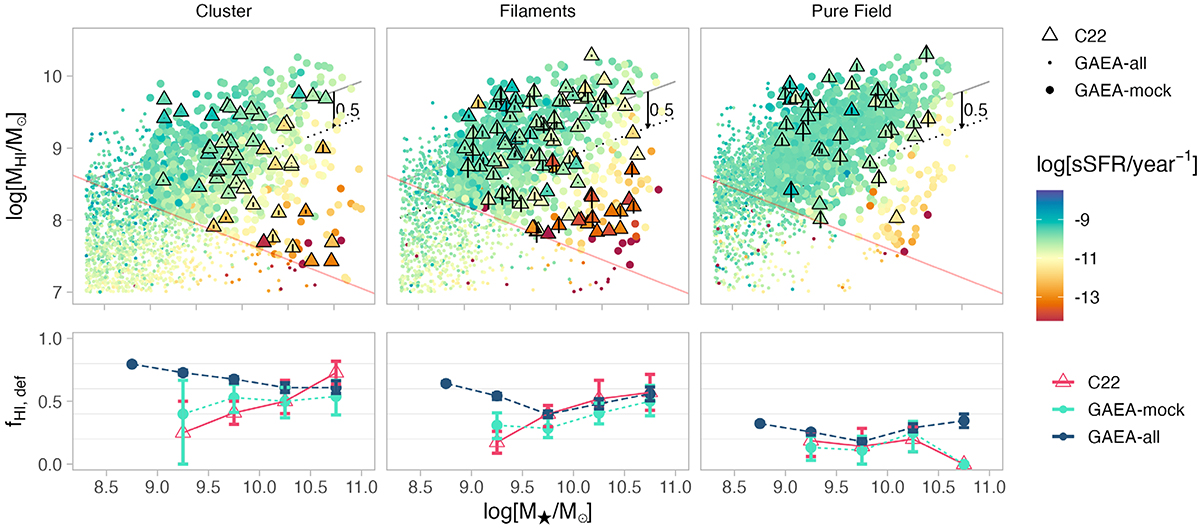
The amount of HI-content in galaxies in clusters, filaments, and pure field. Top: MHI as a function of stellar mass in different environments, indicated on top of each panel. The GAEA model data are shown with circles: small circles represent the GAEA-all set, and big circles represent one of the 300 realisations of the GAEA-mock sample. Big triangles show the C22 data. In all the samples, each point is coloured by sSFR. In each panel, the solid grey line shows the MHI − M⋆ scaling relation (Eq. (5)), the dotted line shows the 0.5 dex indent to highlight HI-deficiency zone. The faint red line represents HI-mass completeness limit from Eq. (1). Bottom: Fractions of HI-deficient galaxies (see Sect. 4.2) with 1σ confidence interval as a function of stellar mass.
Current usage metrics show cumulative count of Article Views (full-text article views including HTML views, PDF and ePub downloads, according to the available data) and Abstracts Views on Vision4Press platform.
Data correspond to usage on the plateform after 2015. The current usage metrics is available 48-96 hours after online publication and is updated daily on week days.
Initial download of the metrics may take a while.