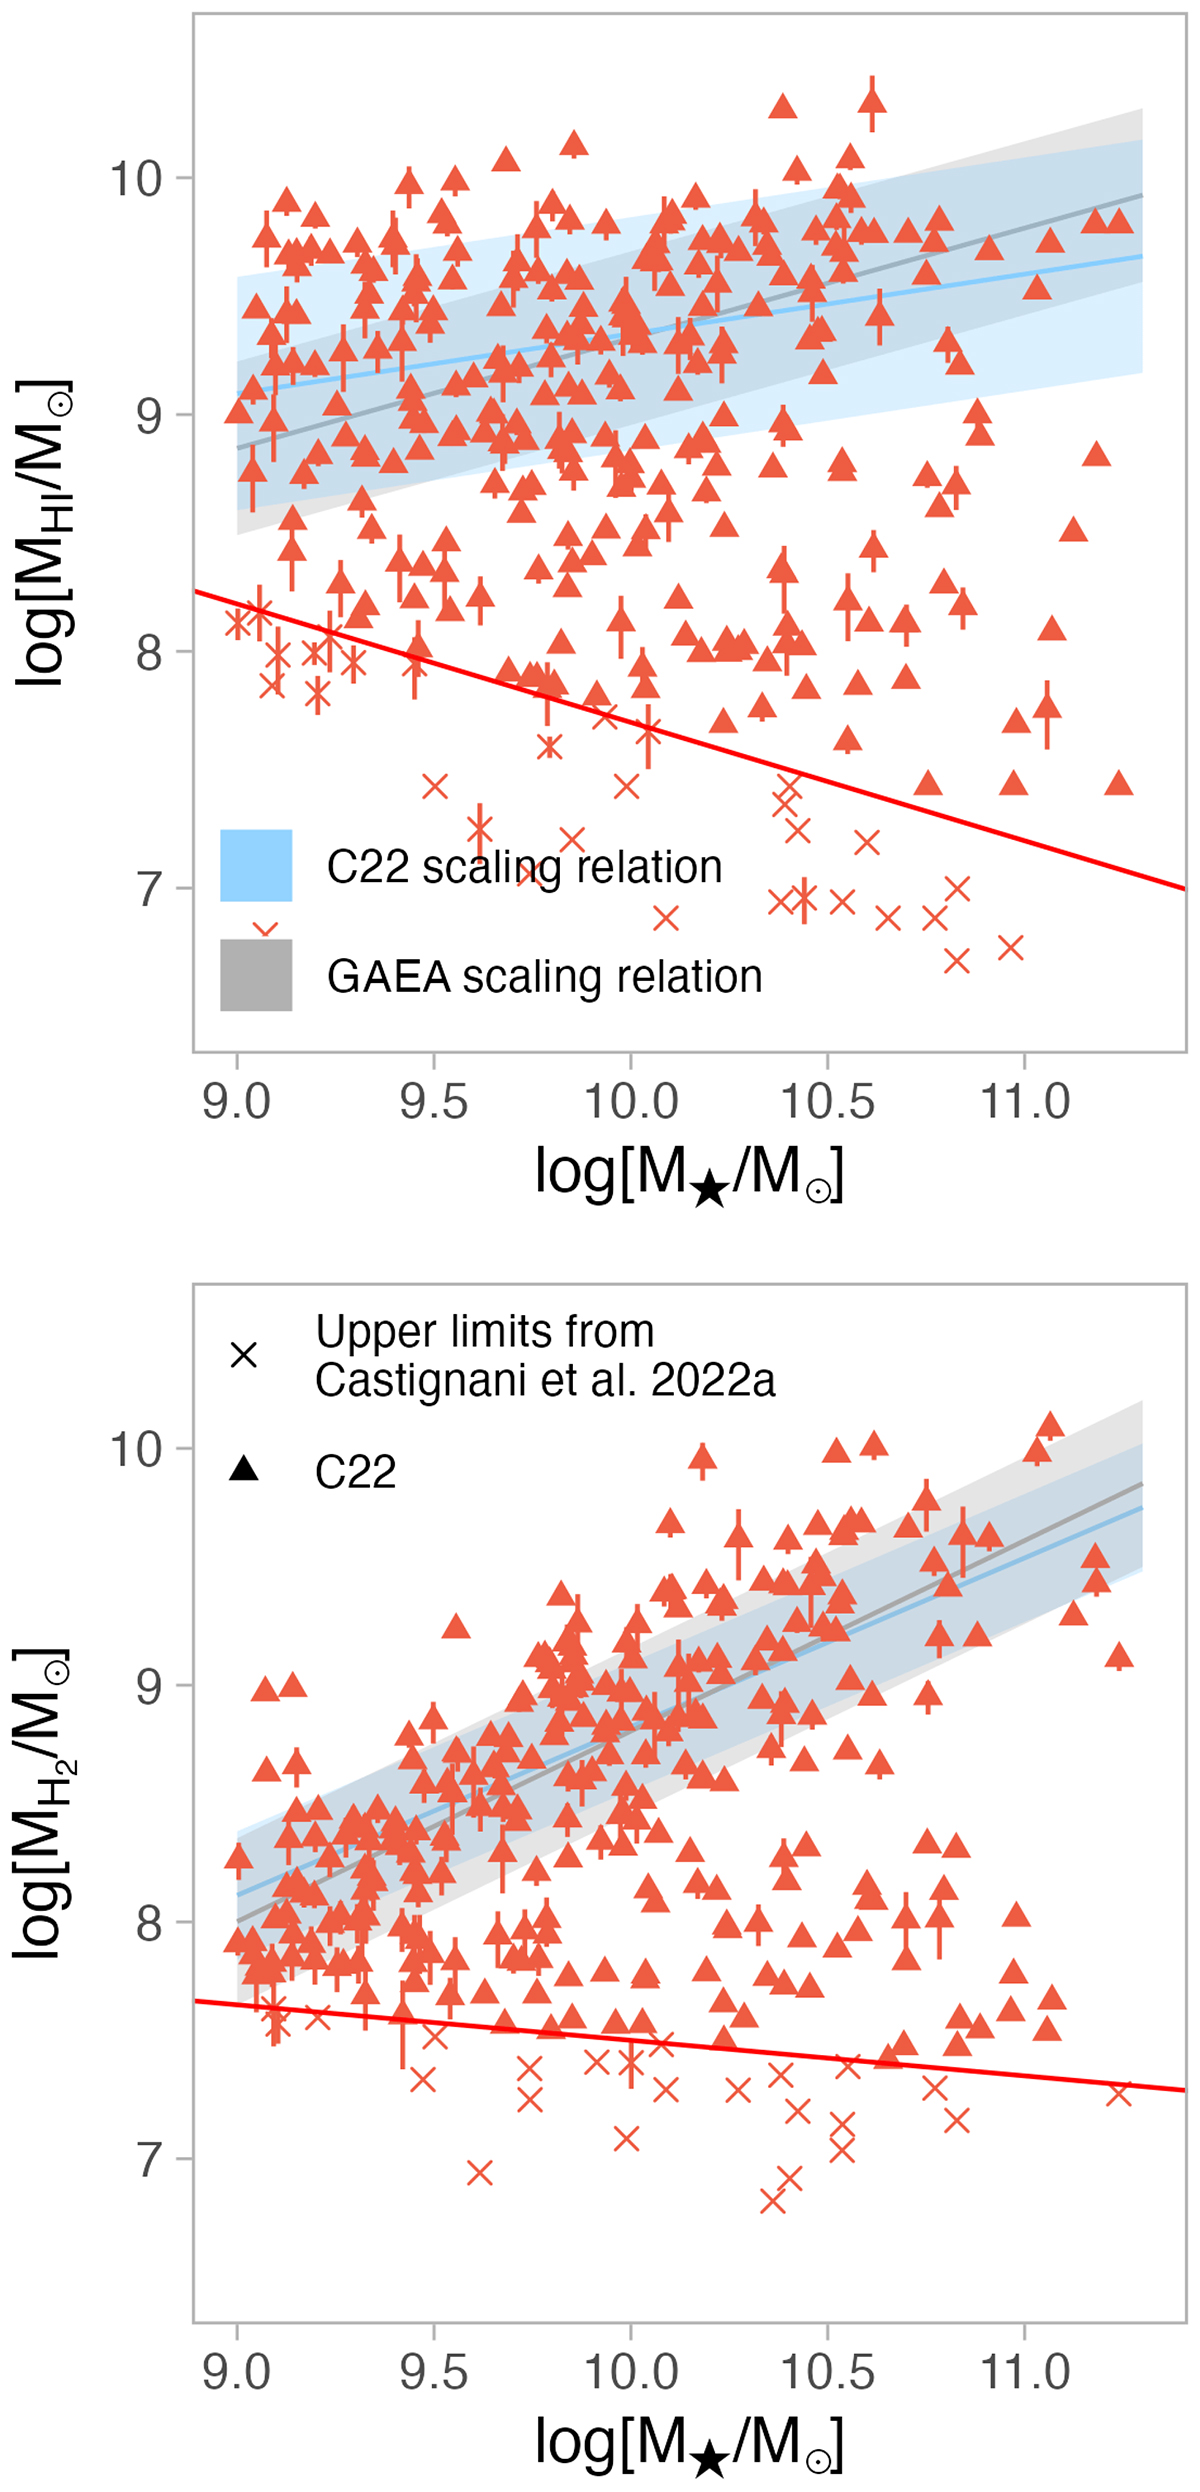
Fig. 2.
Download original image
The scaling relation between MHI (top) and MH2 (bottom) as a function of stellar mass for observations. Red triangles show measurements, and crosses show upper limits. The solid red line shows the adopted level of completeness limits of the observations for HI (Eq. (1)) and H2 (Eq. (2)) masses, respectively. Shaded areas show the scaling relations for C22 (light blue, Eq. (3) in the top panel, Eq. (4) in the bottom panel) and for GAEA (light grey, Eq. (5) in the top panel, Eq. (6) in the bottom panel).
Current usage metrics show cumulative count of Article Views (full-text article views including HTML views, PDF and ePub downloads, according to the available data) and Abstracts Views on Vision4Press platform.
Data correspond to usage on the plateform after 2015. The current usage metrics is available 48-96 hours after online publication and is updated daily on week days.
Initial download of the metrics may take a while.