Fig. 1.
Download original image
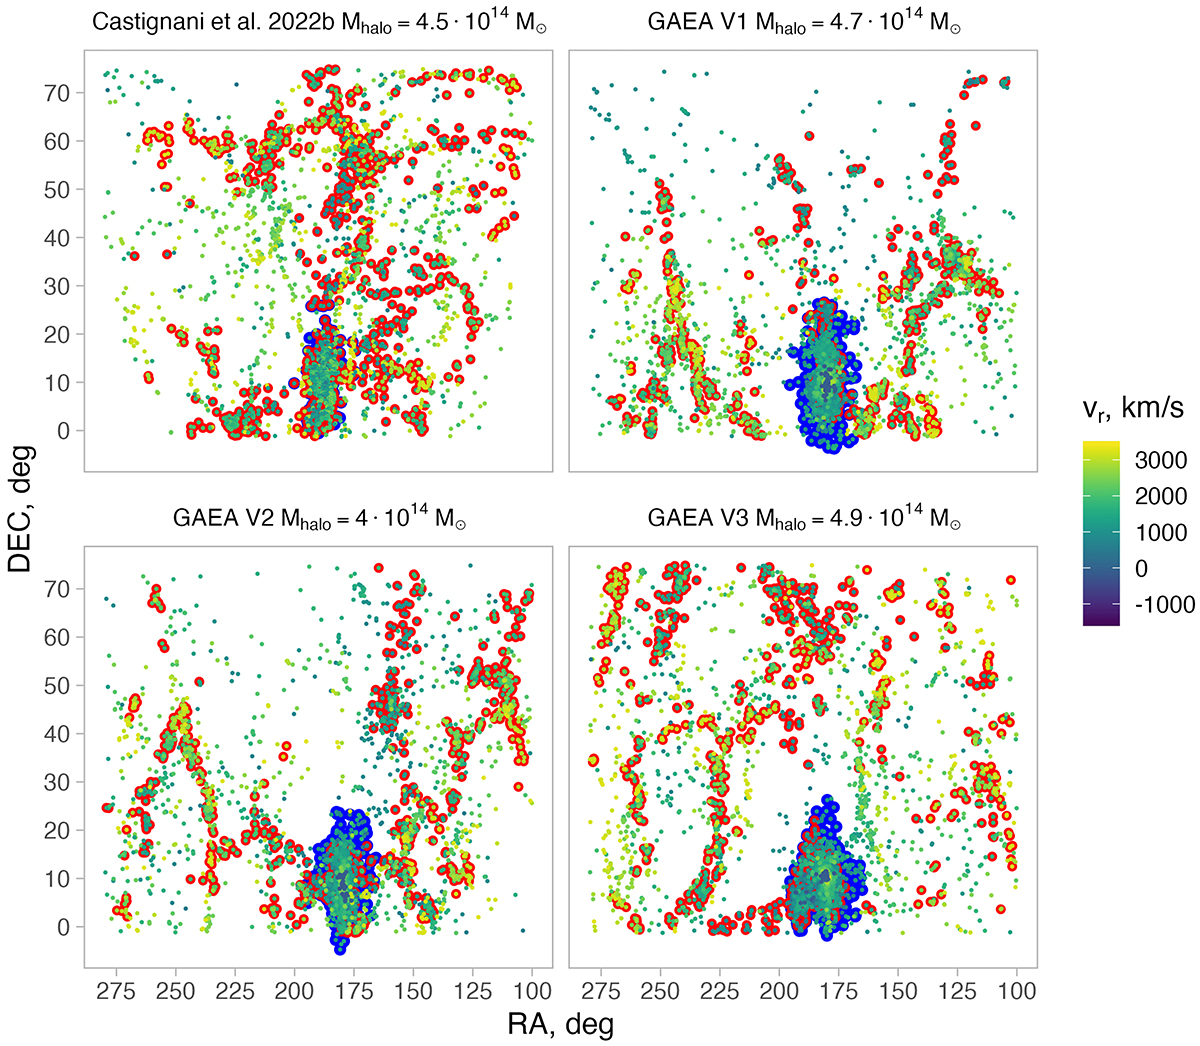
Distribution of galaxies around the Virgo cluster (top-left panel, from Castignani et al. 2022b) and around the three Virgo-like clusters in the GAEA model (top right: GAEA V1, bottom left: GAEA V2, bottom right: GAEA V3) in celestial coordinates (corresponding to the GAEA-all sets; Sect. 4.1). The label of each panel indicates the mass of Virgo or of the Virgo-like halos. Each point is a galaxy with ![]() (mass completeness limit) and is colour-coded by its recessional velocity. Additionally, galaxies belonging to filaments (see Sect. 3.1) are highlighted in red, and the cluster members in blue.
(mass completeness limit) and is colour-coded by its recessional velocity. Additionally, galaxies belonging to filaments (see Sect. 3.1) are highlighted in red, and the cluster members in blue.
Current usage metrics show cumulative count of Article Views (full-text article views including HTML views, PDF and ePub downloads, according to the available data) and Abstracts Views on Vision4Press platform.
Data correspond to usage on the plateform after 2015. The current usage metrics is available 48-96 hours after online publication and is updated daily on week days.
Initial download of the metrics may take a while.