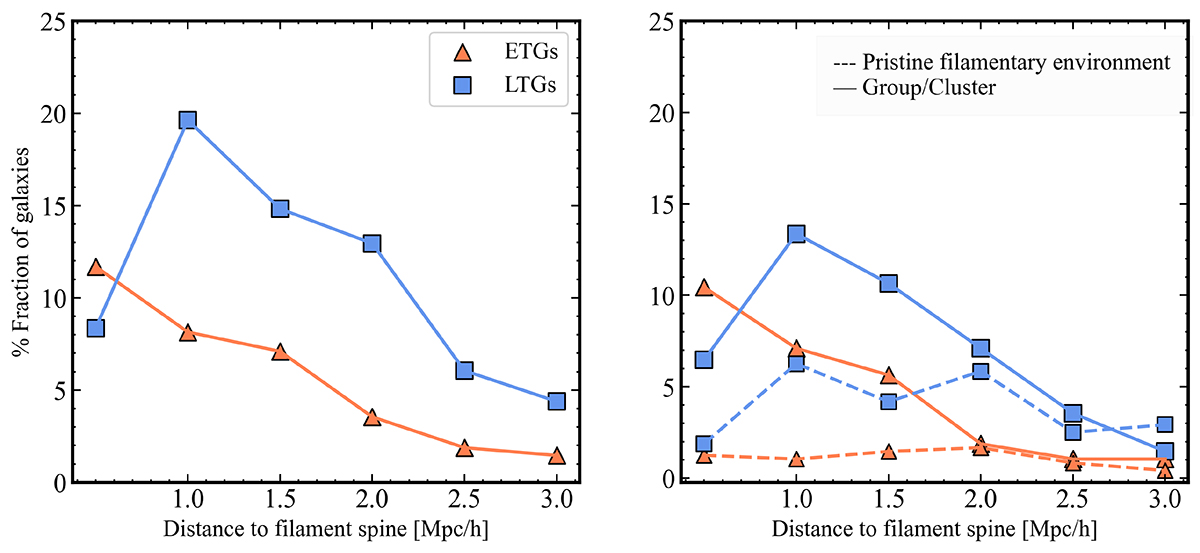
Fig. 8.
Download original image
Morphology of galaxies in filaments around the Fornax-Eridanus complex. In both panels, we show a histogram of ETGs (orange triangles) and LTGs (blue squares) as a function of their distance to the filament spine. In the right panel, the dataset is divided in two categories, pristine filamentary galaxies (dashed lines) and those associated to groups and clusters (solid line).
Current usage metrics show cumulative count of Article Views (full-text article views including HTML views, PDF and ePub downloads, according to the available data) and Abstracts Views on Vision4Press platform.
Data correspond to usage on the plateform after 2015. The current usage metrics is available 48-96 hours after online publication and is updated daily on week days.
Initial download of the metrics may take a while.