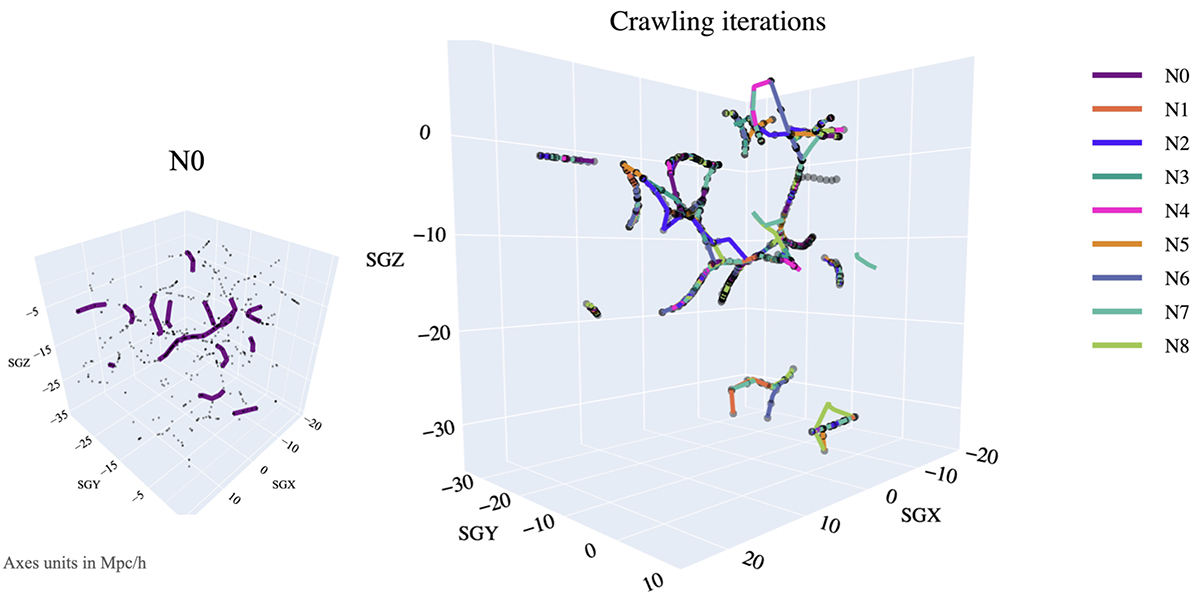
Fig. 3.
Download original image
Results from MMCrawling on the filtered data. The distribution of galaxies in supergalactic coordinates (SGX, SGY, SGZ) is shown in black and the first iteration (N0) of MMCrawling is highlighted in purple in the left panel. Results from all nine iterations from MMCrawling are represented in various colours in the right panel. We visualise each iteration separately in Appendix A.2.
Current usage metrics show cumulative count of Article Views (full-text article views including HTML views, PDF and ePub downloads, according to the available data) and Abstracts Views on Vision4Press platform.
Data correspond to usage on the plateform after 2015. The current usage metrics is available 48-96 hours after online publication and is updated daily on week days.
Initial download of the metrics may take a while.