Fig. A.1.
Download original image
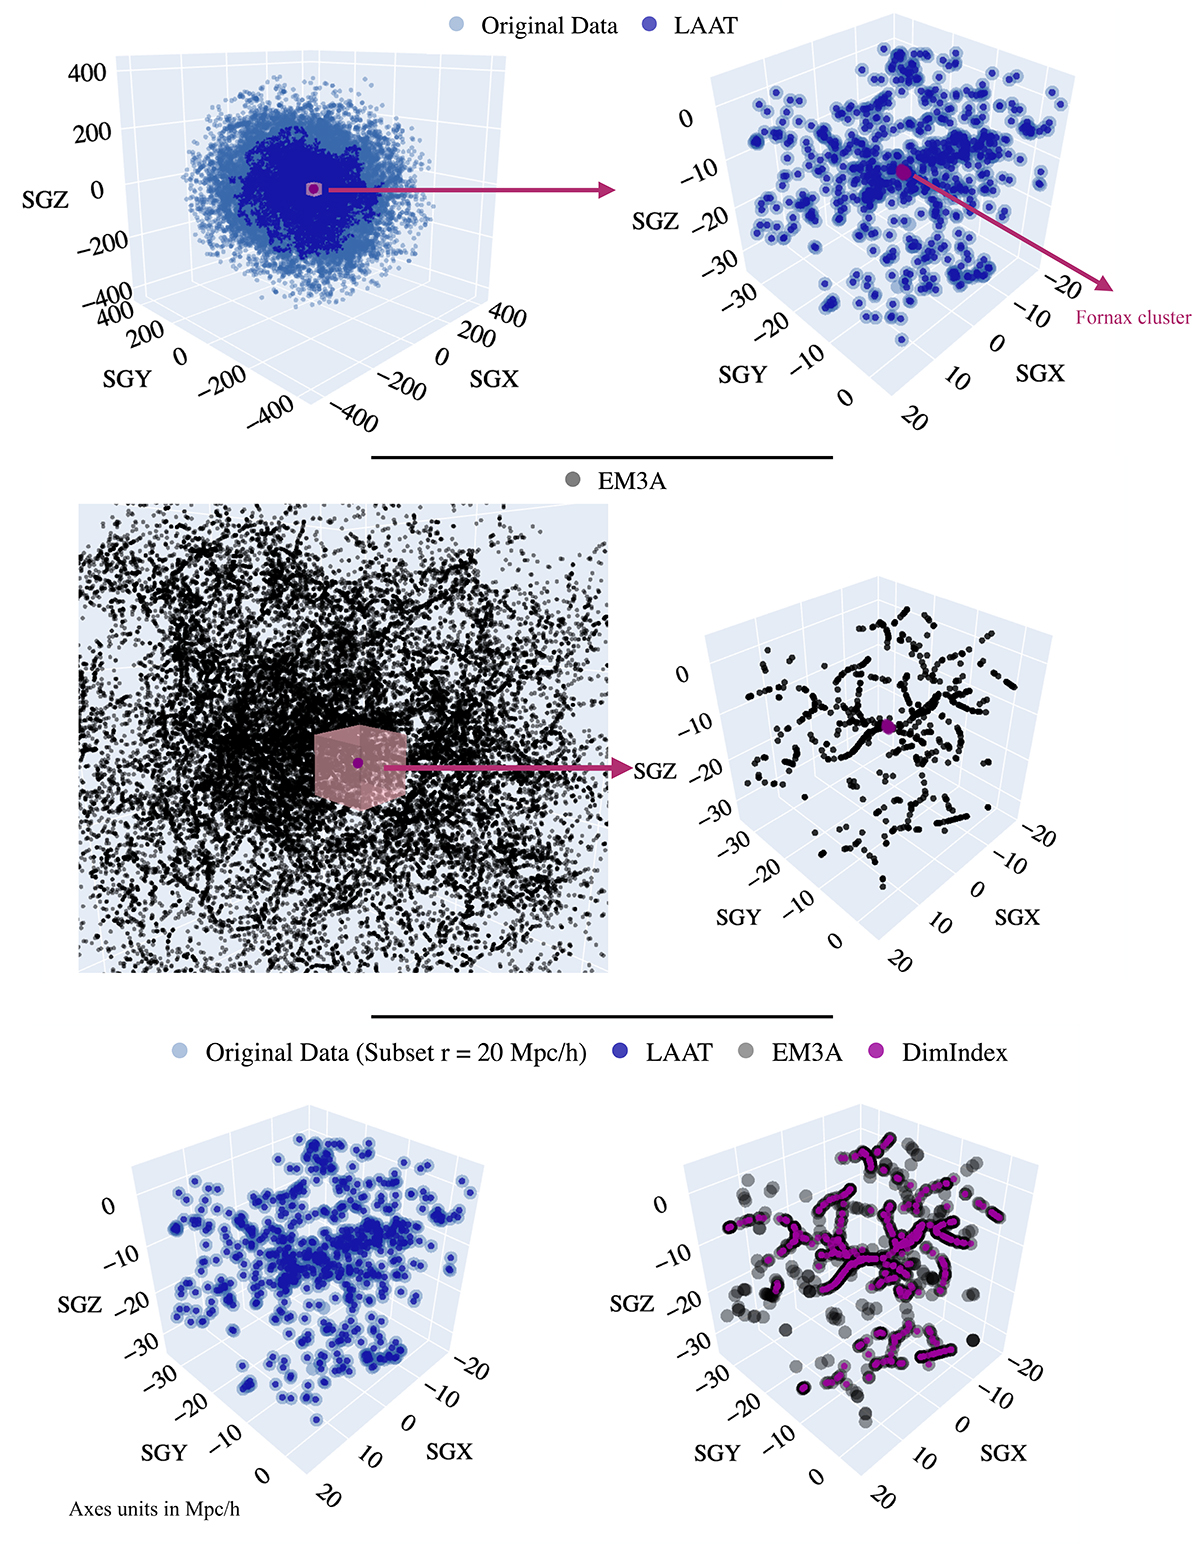
Results of LAAT, EM3A, and DimIndex on our data. Top panel: 3D representation of the original dataset by T16a (left) and the extracted subset (right) are denoted in light blue. Results from LAAT are depicted in dark blue; Middle panel: 3D representation of the results from EM3A on a zoomed-in perspective of the original dataset (left) and its extracted subset (right); Lower panel: description is the same as that of the top panels, but now includes results from DimIndex, which is indicated in magenta.
Current usage metrics show cumulative count of Article Views (full-text article views including HTML views, PDF and ePub downloads, according to the available data) and Abstracts Views on Vision4Press platform.
Data correspond to usage on the plateform after 2015. The current usage metrics is available 48-96 hours after online publication and is updated daily on week days.
Initial download of the metrics may take a while.