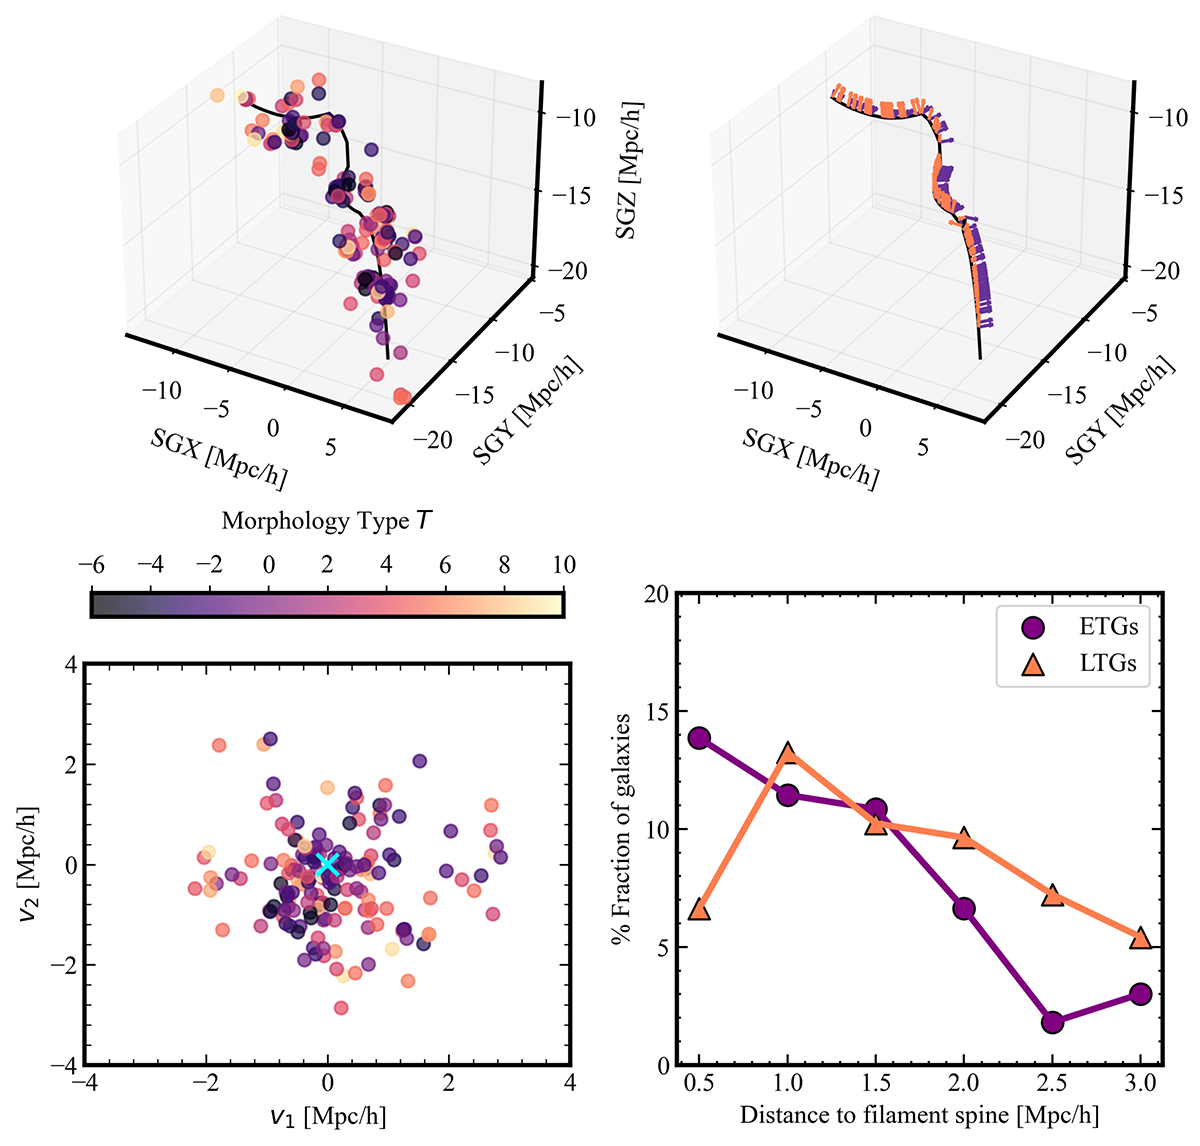
Fig. 10.
Download original image
Morphology of galaxies and cross-sectional view of the Fornax Wall. Top-left panel: 3D view of the Fornax Wall in supergalactic coordinates. Each galaxy is highlighted by its Morphology Type T, as shown on the colour bar. Top-right panel: Normalised vectors for every galaxy on the central axis of the Fornax Wall in crimson and teal. Lower-left panel: Cross-sectional view of all galaxies belonging to the Fornax Wall within a distance of 3 Mpc/h to its centre. The centre is marked with a cyan cross and the galaxies are denoted by their morphology type, T, as shown in the colour bar. Lower-right panel: Histogram of the ETGs (purple circles) and LTGs (orange triangles) as a function of their distance to the Fornax Wall.
Current usage metrics show cumulative count of Article Views (full-text article views including HTML views, PDF and ePub downloads, according to the available data) and Abstracts Views on Vision4Press platform.
Data correspond to usage on the plateform after 2015. The current usage metrics is available 48-96 hours after online publication and is updated daily on week days.
Initial download of the metrics may take a while.