Fig. 13.
Download original image
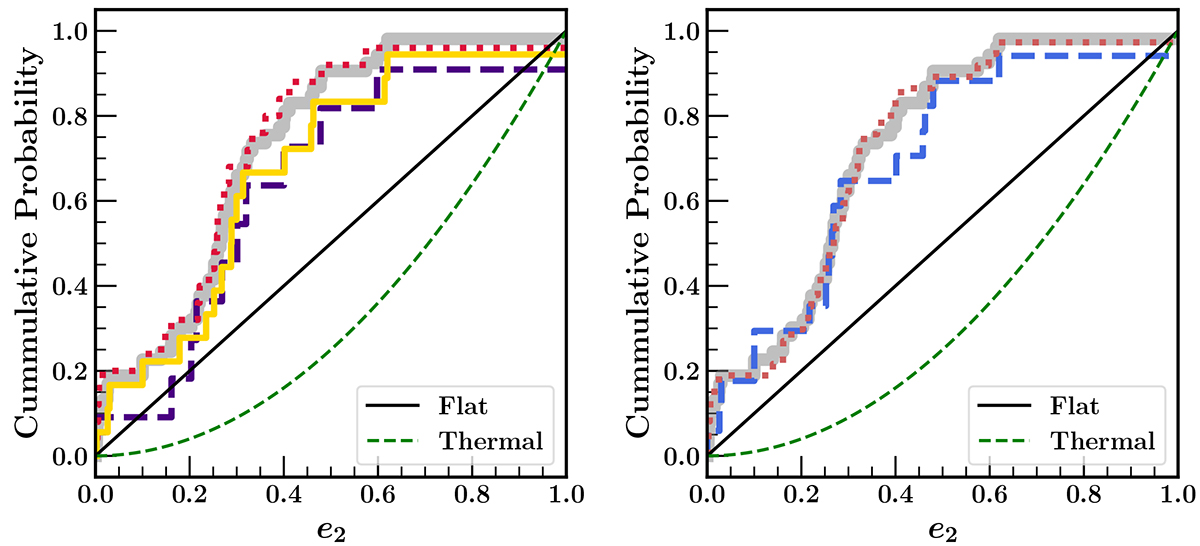
Cumulative eccentricity (e2) distribution of the tertiary orbit of CHTs listed in Table D.1. Left: Cumulative e2 distribution of CHTs of different [fe/H] values. Yellow represents metal-rich samples, red represents solar ones, and purple represents metal-poor ones. Right: Cumulative e2 distribution for young (blue) and old (red) systems. The black line represents the expected trend for a flat distribution and the dashed green line is the expected trend for a thermal distribution of e2. The grey lines in both panels show the total distribution of all the listed CHTs.
Current usage metrics show cumulative count of Article Views (full-text article views including HTML views, PDF and ePub downloads, according to the available data) and Abstracts Views on Vision4Press platform.
Data correspond to usage on the plateform after 2015. The current usage metrics is available 48-96 hours after online publication and is updated daily on week days.
Initial download of the metrics may take a while.