Fig. 7
Download original image
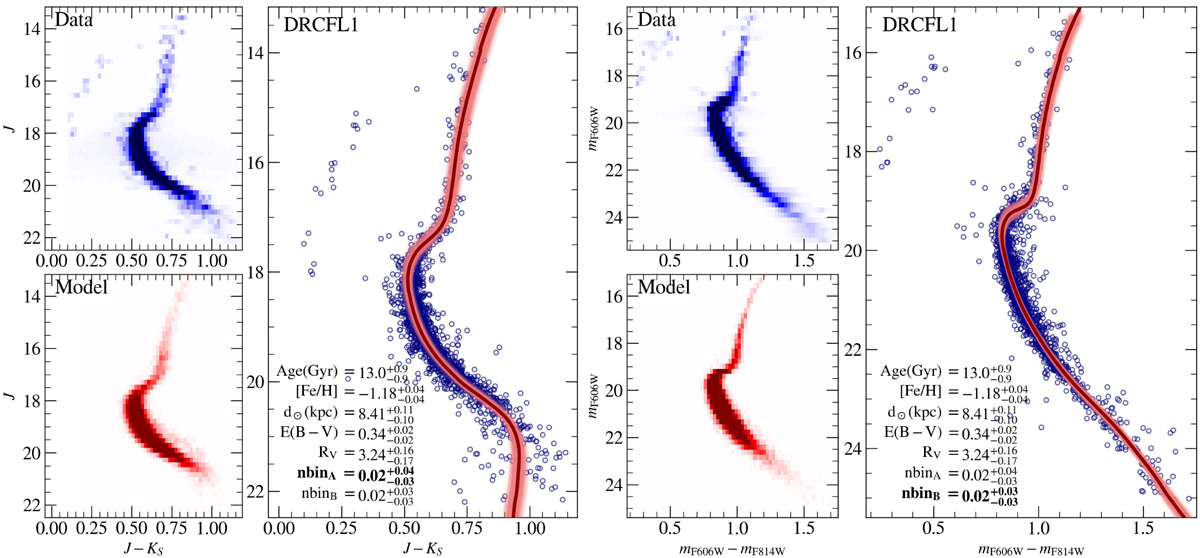
Simultaneous isochrone fitting using the differential reddening correction from fiducial line 1 (DRCFL1). The left panels show the NIR GSAOI CMD and the right panels show the optical F606W/F814W HST CMD. The small panels show the Hess diagram of the data (upper) and model (best-fit synthetic CMD, lower). In the bigger panel, the blue dots are the cluster member stars, the red line represents the isochrone of the best synthetic CMD fit, and the thin lines are solutions within the errors. The values obtained from the simultaneous fitting are shown in the bottom left corner of the bigger panels, with the respective binary fraction value highlighted.
Current usage metrics show cumulative count of Article Views (full-text article views including HTML views, PDF and ePub downloads, according to the available data) and Abstracts Views on Vision4Press platform.
Data correspond to usage on the plateform after 2015. The current usage metrics is available 48-96 hours after online publication and is updated daily on week days.
Initial download of the metrics may take a while.