Fig. 3
Download original image
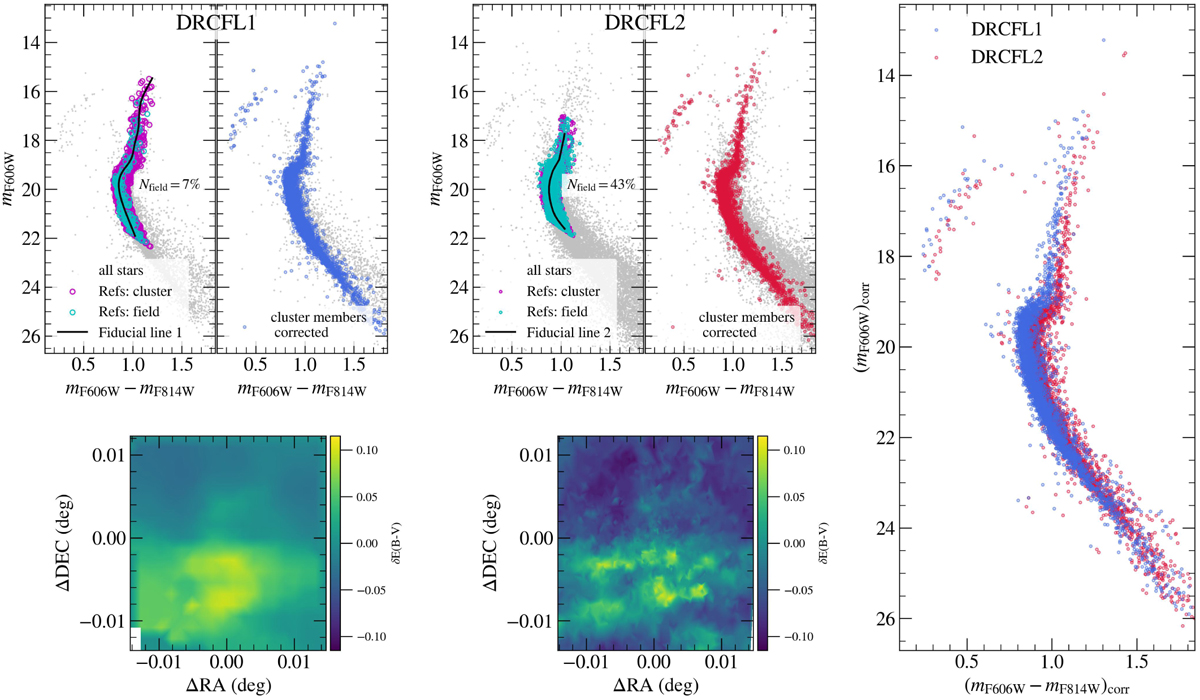
Differential reddening correction procedure. The top left panels show the CMDs with the selected reference stars (the field as cyan dots and cluster as magenta dots, the same as in Figure 2) to generate the fiducial line (black line, left) and the corrected CMD (right). The differential reddening maps are at the bottom with respect to the cluster centre. Both density maps have the same colour code and scale and are limited to the GSAOI FoV. In the left panel is shown the differential reddening correction using the fiducial line constructed from the sample within the GSAOI FoV (DRCFL1), and in the middle panel the differential reddening correction using the fiducial line constructed from stars within the HST/ACS FoV. The right panel directly compares the cluster member stars using DRCFL1 (blue) and DRCFL2 (red).
Current usage metrics show cumulative count of Article Views (full-text article views including HTML views, PDF and ePub downloads, according to the available data) and Abstracts Views on Vision4Press platform.
Data correspond to usage on the plateform after 2015. The current usage metrics is available 48-96 hours after online publication and is updated daily on week days.
Initial download of the metrics may take a while.