Fig. 2
Download original image
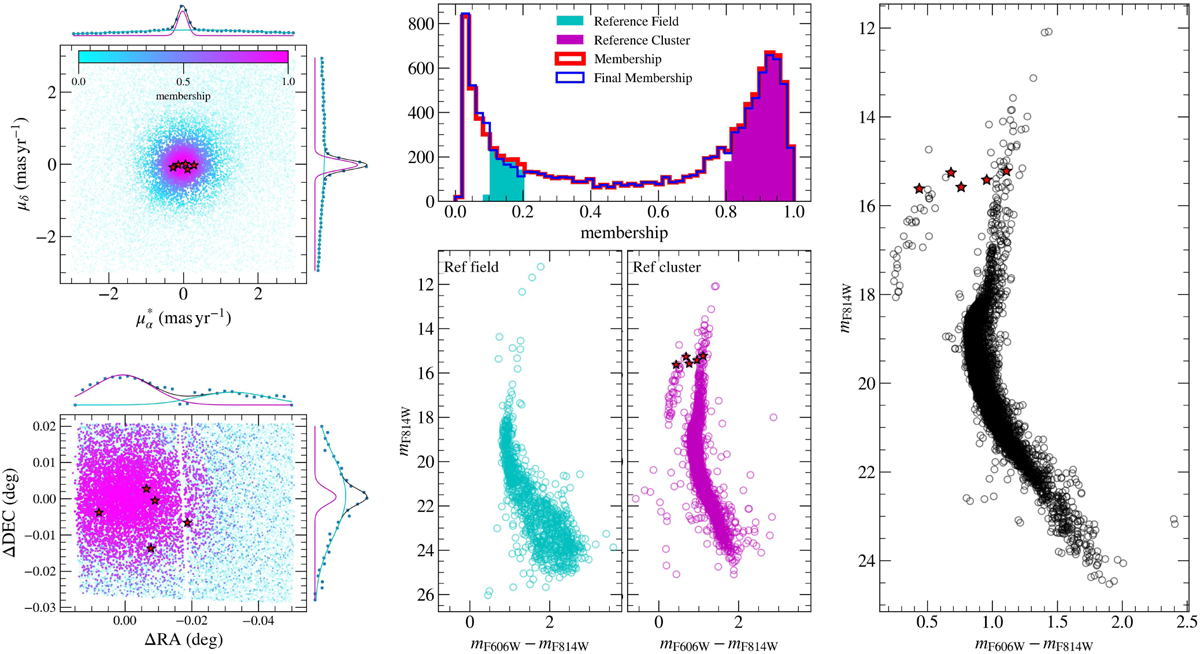
Membership probability derivation. The top left and bottom left panels show the VPD and spatial position from the cluster centre coloured by the membership probability value. The upper corner and right panels show the double Gaussian fitting to the distributions. The top middle panel shows the membership distribution before (red) and after (blue) the cleaning method. The cyan region shows the membership range of reference field stars, while the magenta one is the cluster member probability region. The bottom middle panels show the reference field and cluster stars on the left and right, respectively. The cleaned CMD is shown in the right panel. The red star symbols show the OGLE RR Lyrae classified as members following the membership method.
Current usage metrics show cumulative count of Article Views (full-text article views including HTML views, PDF and ePub downloads, according to the available data) and Abstracts Views on Vision4Press platform.
Data correspond to usage on the plateform after 2015. The current usage metrics is available 48-96 hours after online publication and is updated daily on week days.
Initial download of the metrics may take a while.