Fig. 10
Download original image
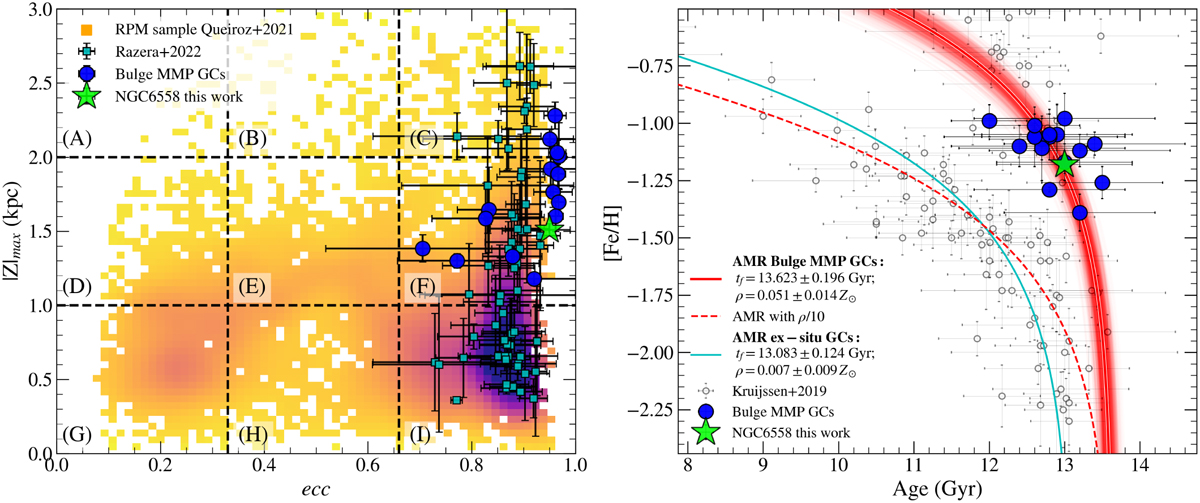
Analysis of the moderately metal-poor side of the Galactic bulge GCs. Left panel: ecc vs. |Z|max plane divided into nine regions named from A to I. The background density map shows the RPM sample (Queiroz et al. 2021): the blue dots are the MMP GCs, and the cyan squares are the 58 Galactic bulge spheroid stars from Razera et al. (2022). NGC 6558 is the green star symbo (see Pérez-Villegas et al. 2020; Queiroz et al. 2021; Razera et al. 2022 for the orbital parameter calculations). Right panel: Derivation of the AMR (red line) for the sample of GCs in Table 3 (blue dots). The thin red lines correspond to the AMR varying the mean parameters within errors. The dashed red line shows the AMR assuming a chemical enhancement ten times slower than the one derived for the MMPGCs, while the cyan line is the AMR fitted to the ex situ GCs.
Current usage metrics show cumulative count of Article Views (full-text article views including HTML views, PDF and ePub downloads, according to the available data) and Abstracts Views on Vision4Press platform.
Data correspond to usage on the plateform after 2015. The current usage metrics is available 48-96 hours after online publication and is updated daily on week days.
Initial download of the metrics may take a while.