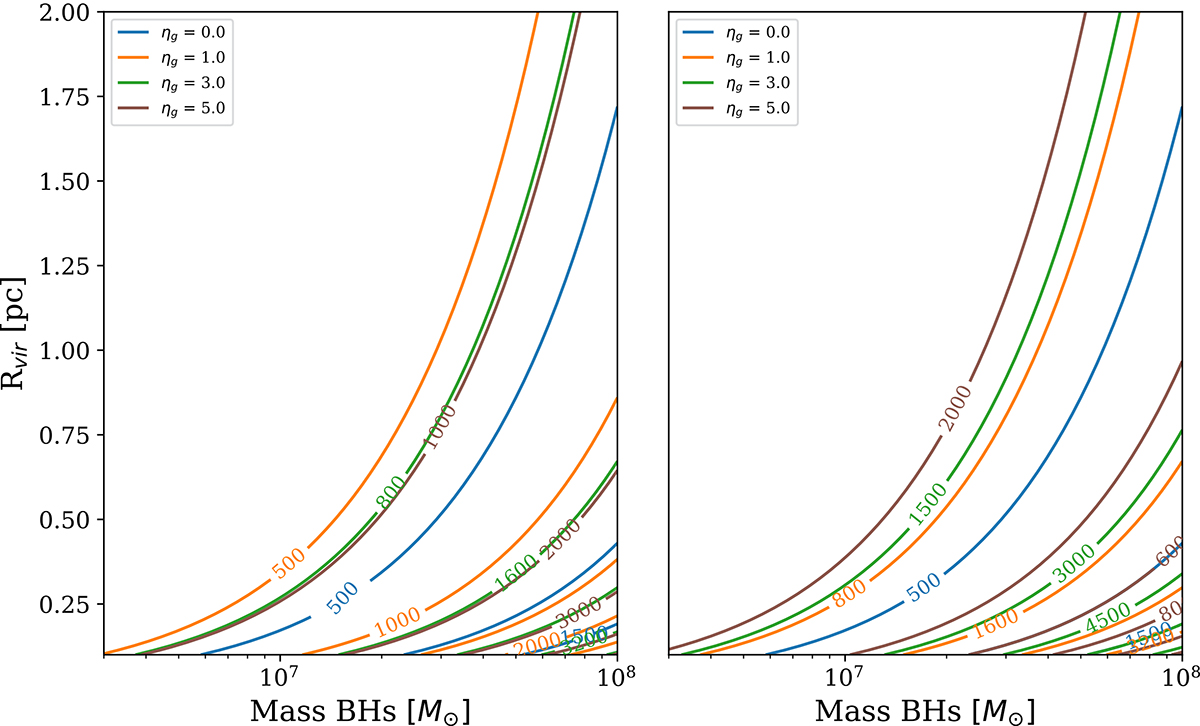
Fig. 9.
Download original image
RMS velocity of the cluster at different external potential. In the left panel, we show the rms contour lines of the velocity calculated via Eq. (8), providing its dependency on the virial radius and the total BH mass in the cluster. The contours illustrate the velocities at specific radii and masses. The bottom right panel provides contour lines of the velocity of the cluster defined by Eq. (9), assuming an additional contraction calculated by Kroupa et al. (2020). The different colors indicate various values of ηg.
Current usage metrics show cumulative count of Article Views (full-text article views including HTML views, PDF and ePub downloads, according to the available data) and Abstracts Views on Vision4Press platform.
Data correspond to usage on the plateform after 2015. The current usage metrics is available 48-96 hours after online publication and is updated daily on week days.
Initial download of the metrics may take a while.