Open Access
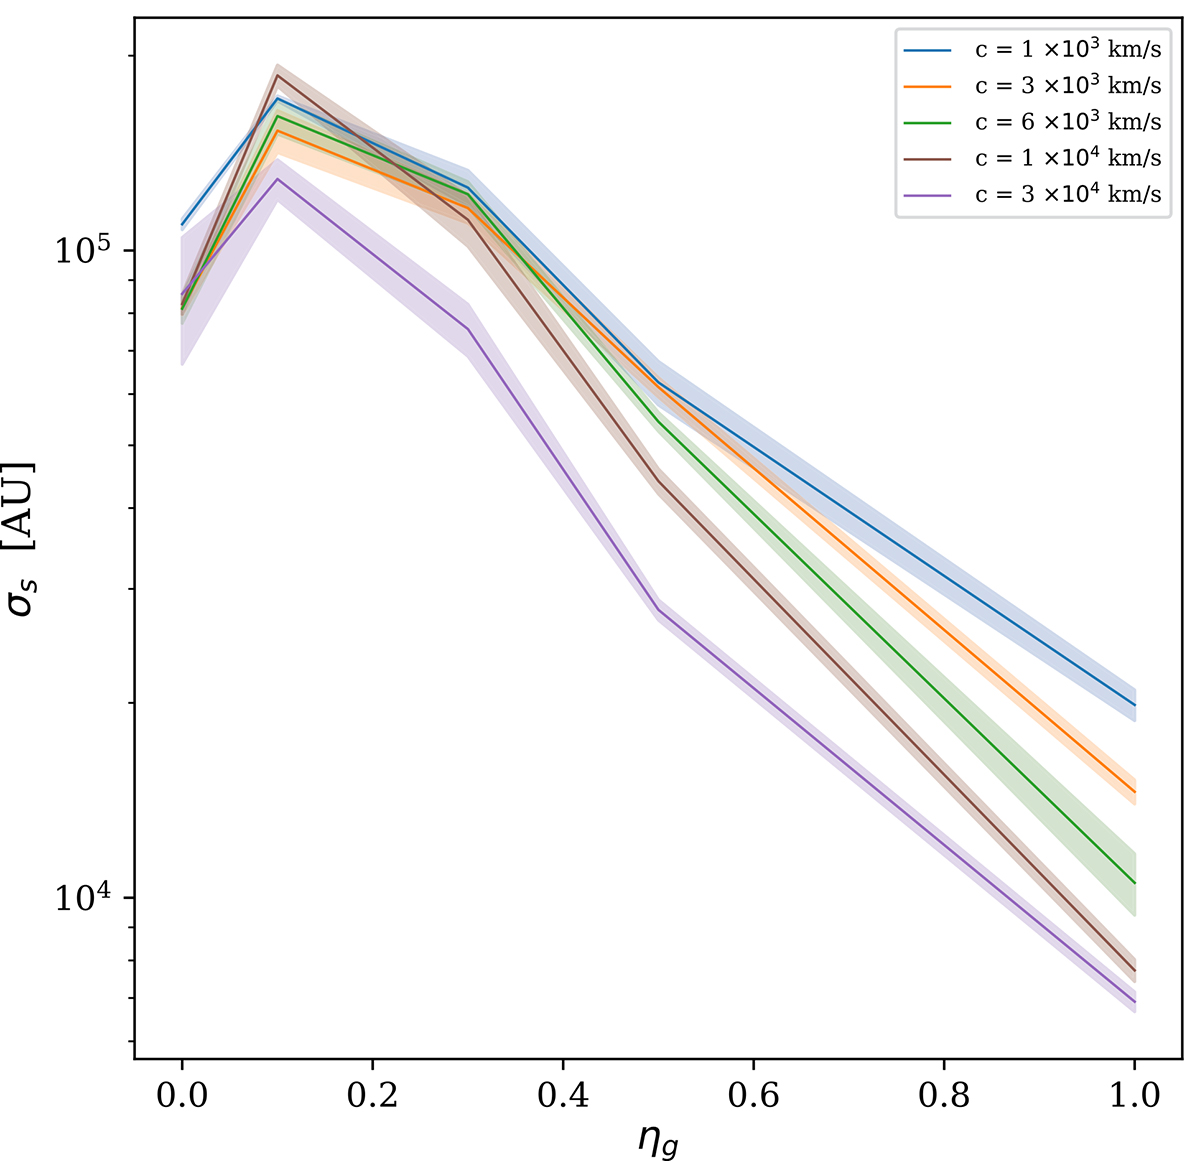
Fig. 6.
Download original image
Root mean square dispersion of the semi-mayor axes of the binaries in the cluster as a function of the external potential (ηg). The different colors correspond to different speeds of light. The shadow regions correspond to the error associated with the random initial conditions.
Current usage metrics show cumulative count of Article Views (full-text article views including HTML views, PDF and ePub downloads, according to the available data) and Abstracts Views on Vision4Press platform.
Data correspond to usage on the plateform after 2015. The current usage metrics is available 48-96 hours after online publication and is updated daily on week days.
Initial download of the metrics may take a while.