Open Access
Fig. 5.
Download original image
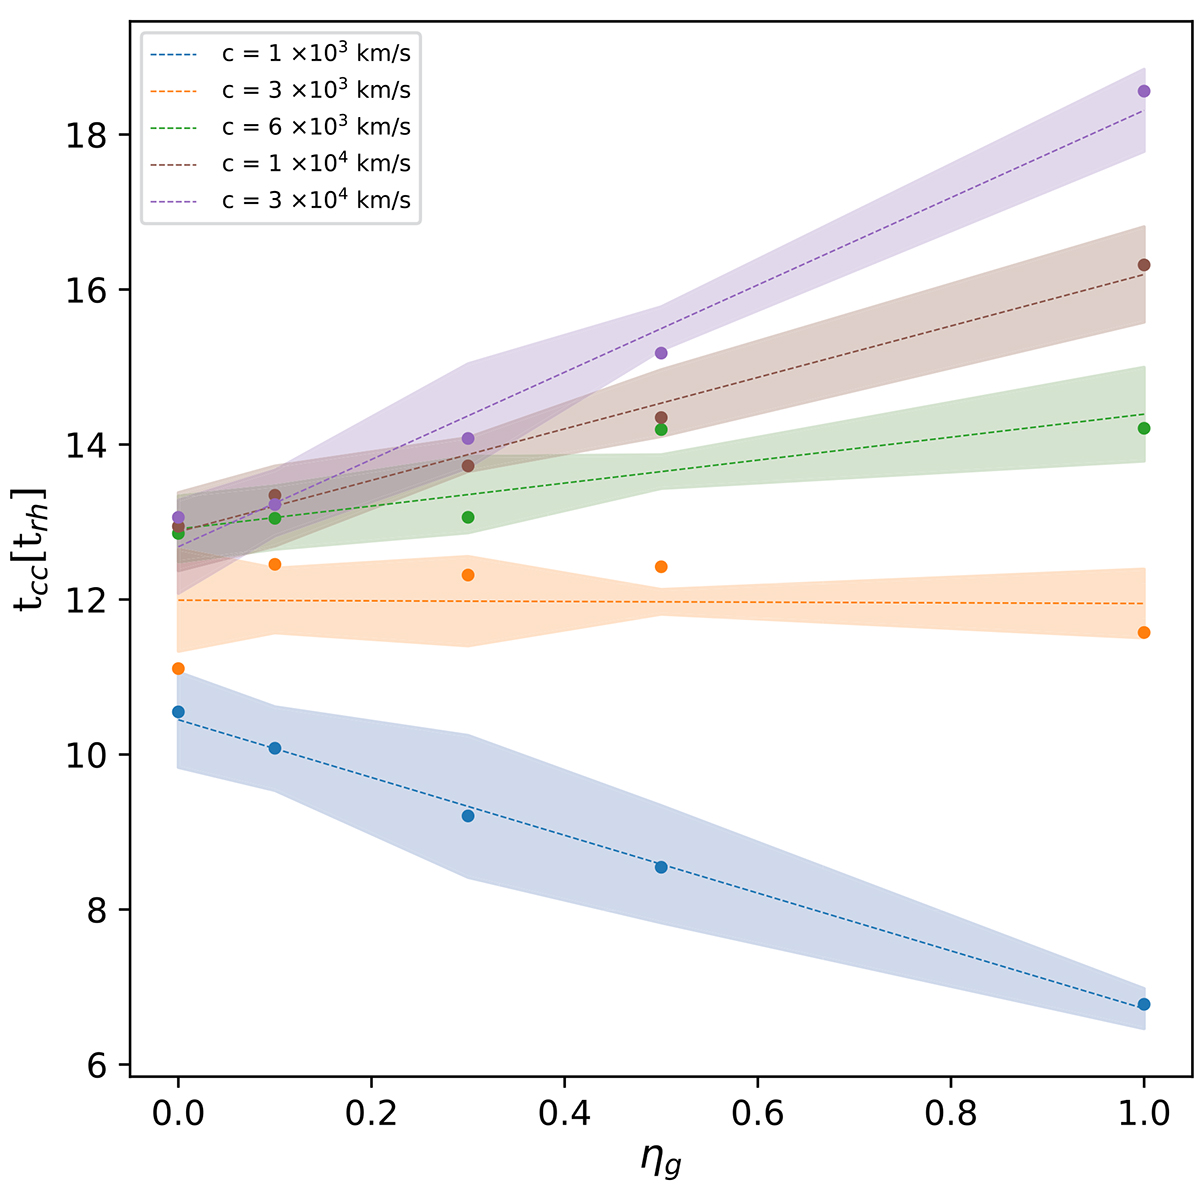
Core collapse time relative to the half-mass relaxation time as a function of the gas mass fraction of the cluster, denoted as ηg. Each curve represents a different value of the speed of light, c. The shadow zone is the error computed via the standard deviation from simulations with different initial conditions.
Current usage metrics show cumulative count of Article Views (full-text article views including HTML views, PDF and ePub downloads, according to the available data) and Abstracts Views on Vision4Press platform.
Data correspond to usage on the plateform after 2015. The current usage metrics is available 48-96 hours after online publication and is updated daily on week days.
Initial download of the metrics may take a while.