Fig. 3.
Download original image
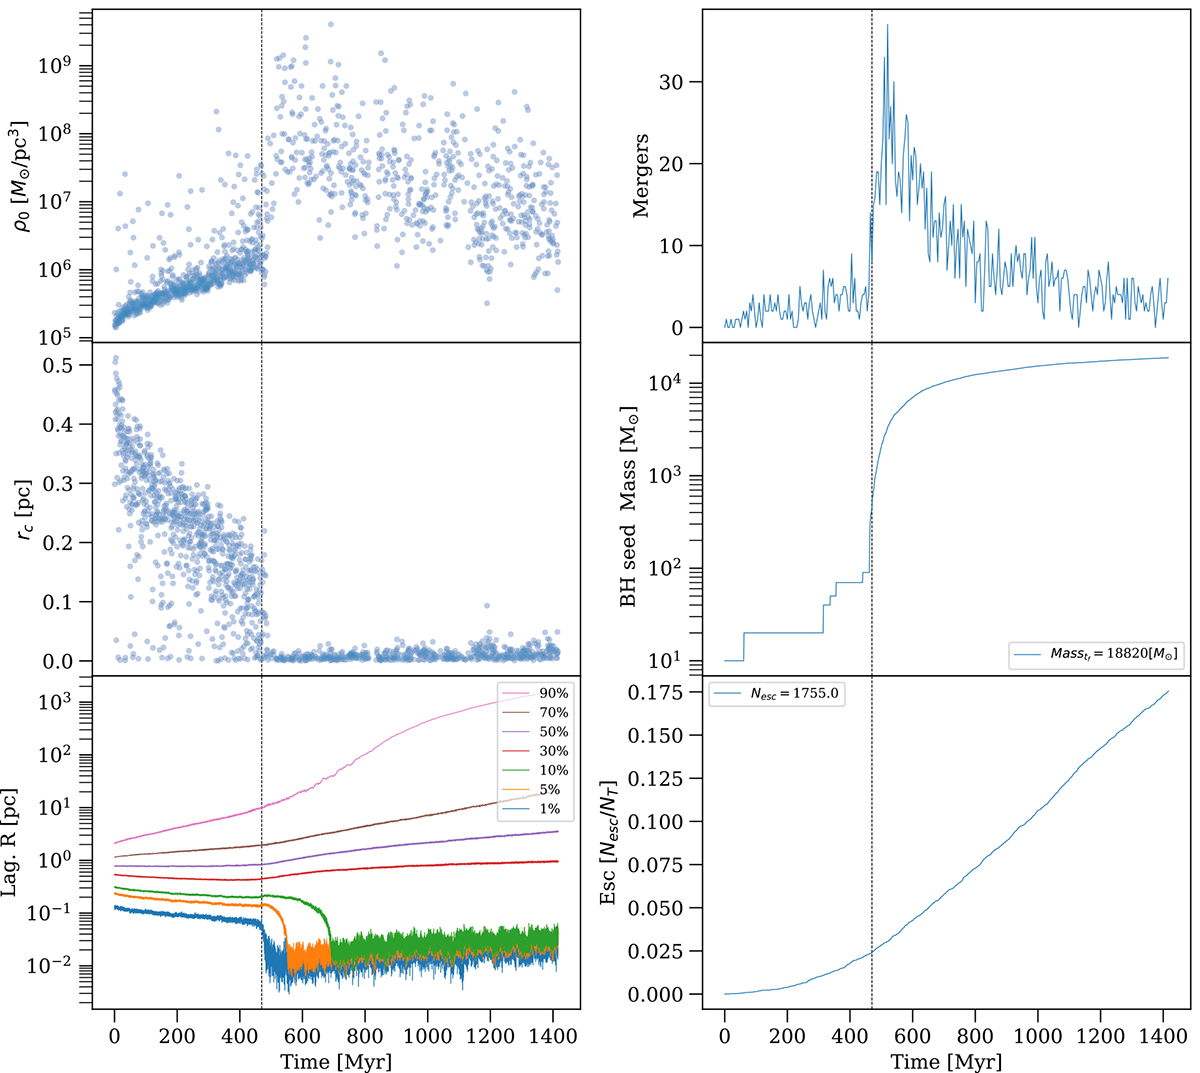
Evolution of the cluster in a simulation with speed of light c = 103 km/s and an external potential of ηg = 1.0. The first two panels on the left present the results of our fit considering a King’s model. In the top left panel, we display the density of the core, while in the second panel from the left at the top, we illustrate the core radius of the cluster. In the bottom left panel, we show the Lagrangian radius for mass fractions between 1% and 90% of the total mass of the cluster. The top right panel shows the mergers of BHs in the cluster in bins of 5 Myr. In the middle right panel we show the growth in the mass of the most massive BH in the cluster. The bottom right panel shows the accumulative ejections in the cluster. The vertical line in the panels corresponds to the moment when the highest central density is reached.
Current usage metrics show cumulative count of Article Views (full-text article views including HTML views, PDF and ePub downloads, according to the available data) and Abstracts Views on Vision4Press platform.
Data correspond to usage on the plateform after 2015. The current usage metrics is available 48-96 hours after online publication and is updated daily on week days.
Initial download of the metrics may take a while.