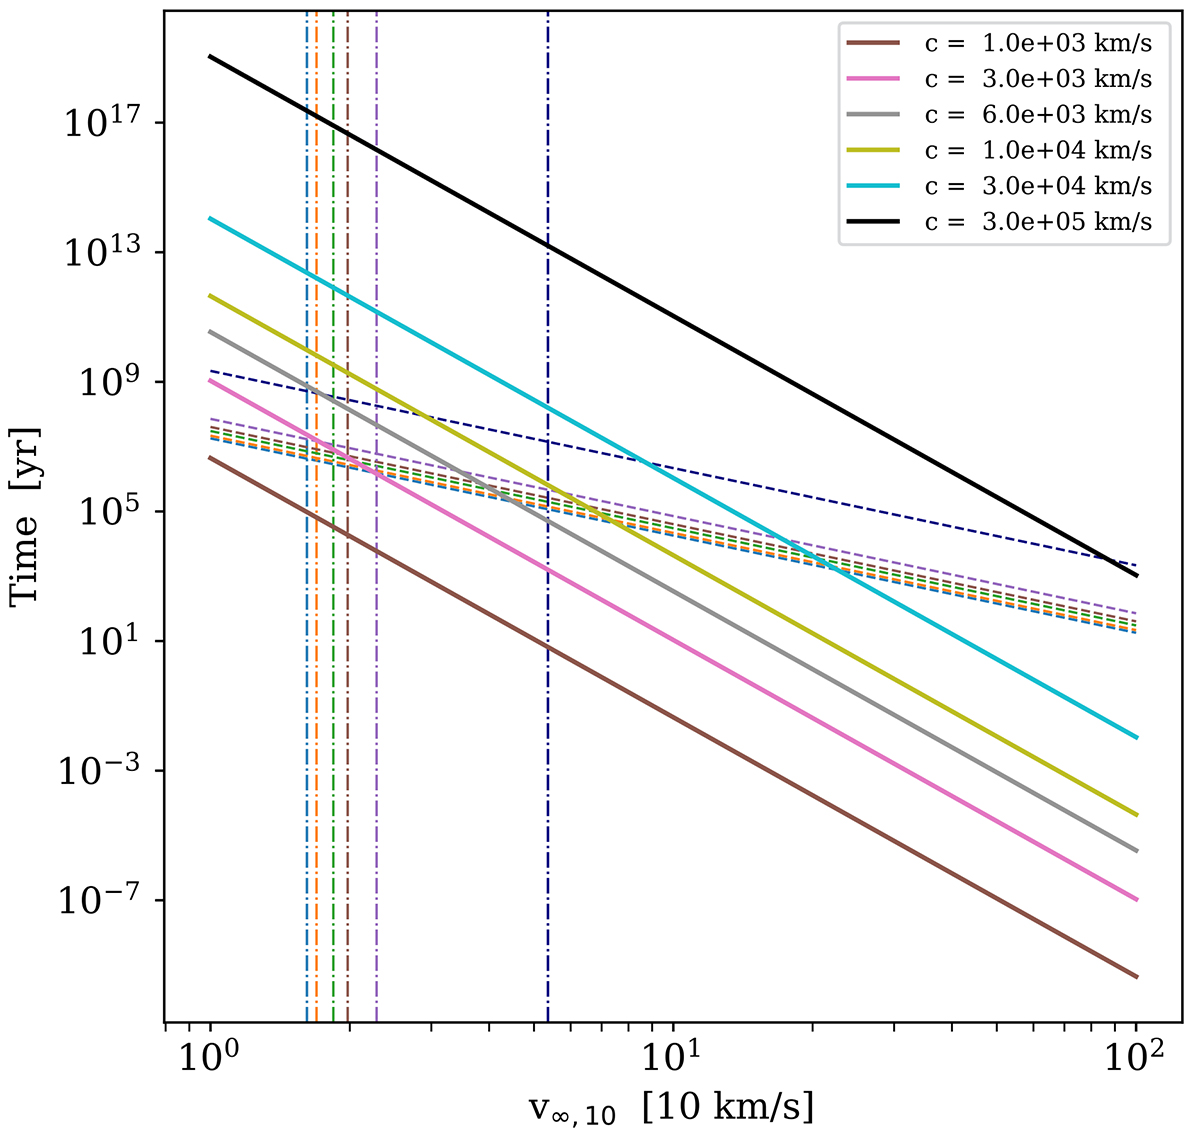
Fig. 1.
Download original image
Different timescales in years: the timescale for binary-single encounters given by Eq. (2) (dashed lines) and gravitational radiation inspiral given by Eq. (3) (solid lines), considering a variation in the gas mass fraction between ηg = 0.0, 0.1, 0.3, 0.5, 1.0, 10.0, with the lowest value in the dashed blue line and the highest value in the violet. We also employed different values of the speed of light, from c = 103 km/s (dashed brown line) to the real value of c = 3 × 10⁵ km/s (solid dark line). The vertical lines show the velocity dispersion given by v∞ for different gas mass fractions.
Current usage metrics show cumulative count of Article Views (full-text article views including HTML views, PDF and ePub downloads, according to the available data) and Abstracts Views on Vision4Press platform.
Data correspond to usage on the plateform after 2015. The current usage metrics is available 48-96 hours after online publication and is updated daily on week days.
Initial download of the metrics may take a while.