Fig. B.2
Download original image
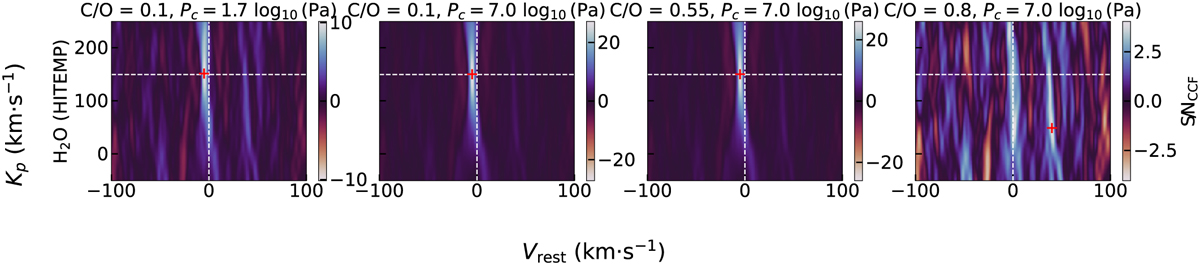
Simulated data: cross-correlation signal-to-noise ratio (S/NCCF) Kp−Vrest maps using a H2O template with the HITEMP line list for a selection of simulated datasets constructed with the POKAZATEL H2O line list. The leftmost column displays the results obtained with a C/O ratio of 0.1, and an opaque cloud top pressure of 1.7 log10(Pa). Going to the right, the columns display the results from cloudless (Pc = 7 log10(Pa)) simulated datasets, with C/O ratio of 0.1, 0.55, and 0.8, respectively. Negative values indicate an anti-correlation of the template with the data. The vertical and horizontal dashed lines show the expected Kp of the planet and the 0 km·s−1 rest velocity, respectively. The red cross indicates the location of the maximum S/N. Rest velocities lower than −100 km·s−1 and larger than +100 km·s−1 are not shown for clarity.
Current usage metrics show cumulative count of Article Views (full-text article views including HTML views, PDF and ePub downloads, according to the available data) and Abstracts Views on Vision4Press platform.
Data correspond to usage on the plateform after 2015. The current usage metrics is available 48-96 hours after online publication and is updated daily on week days.
Initial download of the metrics may take a while.