Fig. 9
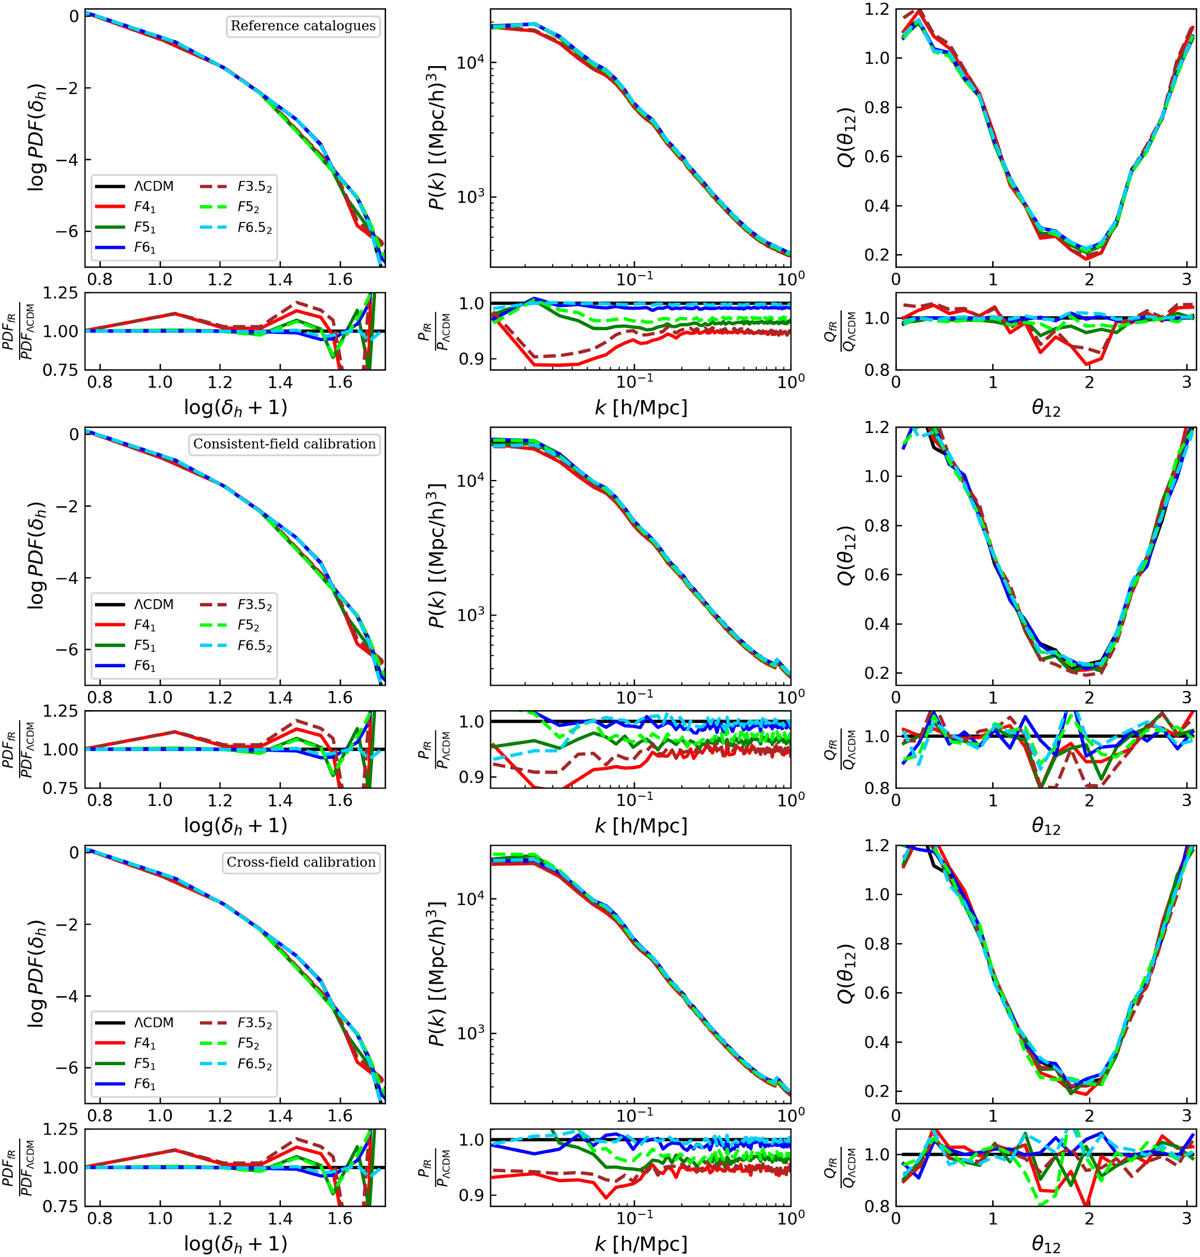
Download original image
Comparison of the PDFs (left), power spectra (P(k); middle), and reduced bispectra (Q(k1, k2, θ12); right) from the calibration stage obtained with BAM for the different MG models, as labelled. Upper panels: reference halo catalogues. Middle row: mock calibration created with BAM from the consistent MG DM field of each model. Lower row: mock calibration created with BAM from the DM field of the ΛCDM model. Note that all the comparisons are made between the MG model with respect to the ΛCDM field.
Current usage metrics show cumulative count of Article Views (full-text article views including HTML views, PDF and ePub downloads, according to the available data) and Abstracts Views on Vision4Press platform.
Data correspond to usage on the plateform after 2015. The current usage metrics is available 48-96 hours after online publication and is updated daily on week days.
Initial download of the metrics may take a while.