Fig. 2
Download original image
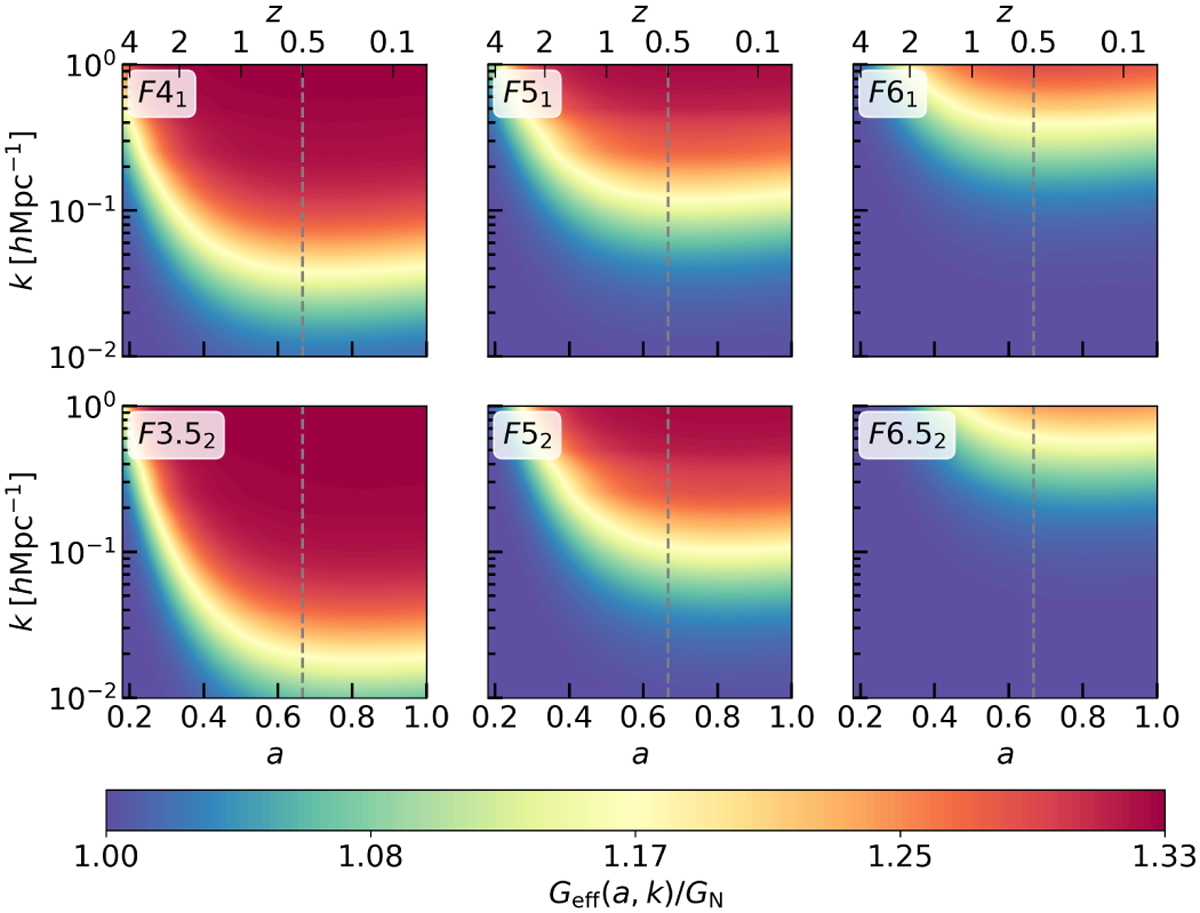
Normalised effective gravitational constant of the HS model variants, as labelled in the respective panels. The colour intensity represents variations in Geff(k, a) across the scale factor, a, and Fourier modes, k. The dashed grey line corresponds to the redshift of interest in our simulations, i.e. z = 0.5. The colour bar indicates the intensity of deviation from the ΛCDM model.
Current usage metrics show cumulative count of Article Views (full-text article views including HTML views, PDF and ePub downloads, according to the available data) and Abstracts Views on Vision4Press platform.
Data correspond to usage on the plateform after 2015. The current usage metrics is available 48-96 hours after online publication and is updated daily on week days.
Initial download of the metrics may take a while.