Fig. 7
Download original image
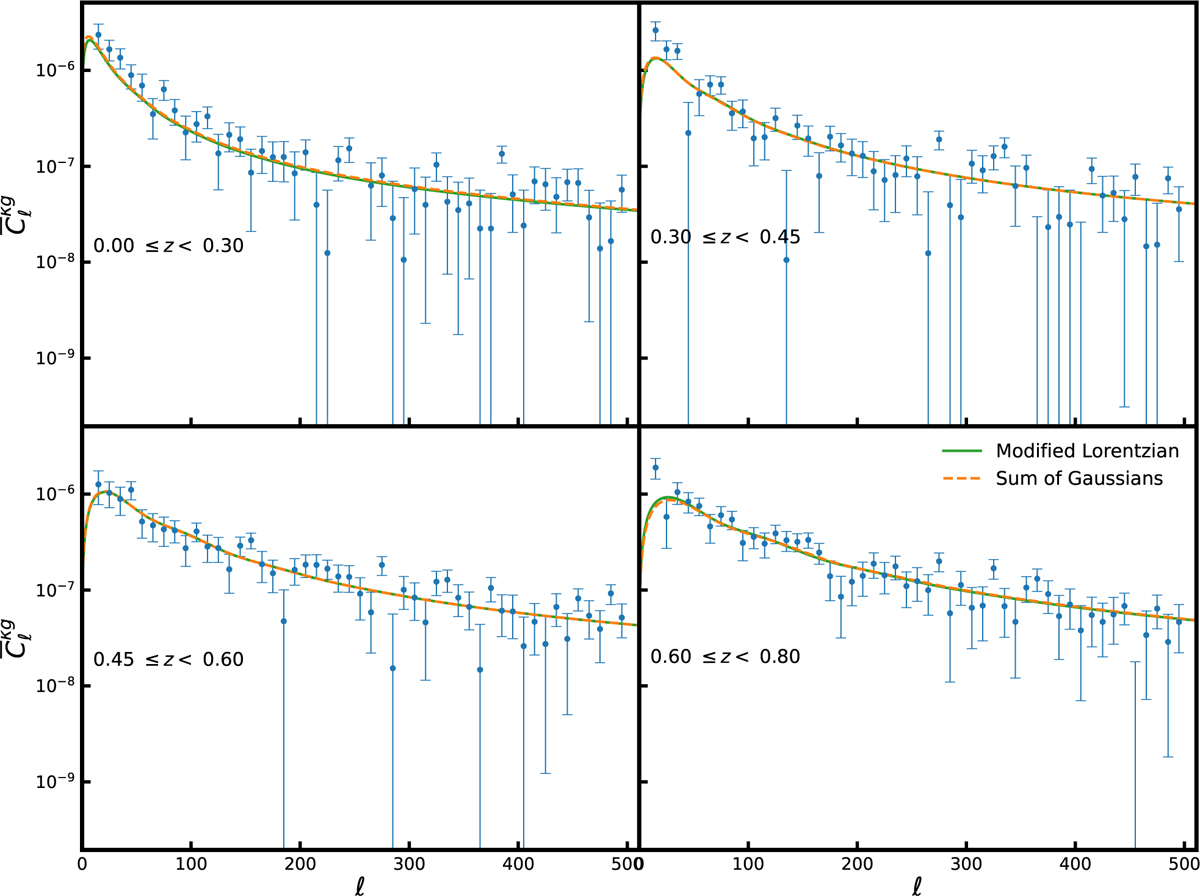
Cross-power spectrum measured from four DESI-LIS tomographic bins. The green solid line is the theoretical power spectrum computed following our best-fit estimates of parameters b and A using the modified Lorentzian fit to the error distribution. The orange dashed line is the theoretical power spectrum corresponding to the sum of Gaussians fit to the error distribution. The standard error bars are computed from the covariance matrix used in the likelihood function, i.e. Eq. (18).
Current usage metrics show cumulative count of Article Views (full-text article views including HTML views, PDF and ePub downloads, according to the available data) and Abstracts Views on Vision4Press platform.
Data correspond to usage on the plateform after 2015. The current usage metrics is available 48-96 hours after online publication and is updated daily on week days.
Initial download of the metrics may take a while.