Fig. 3
Download original image
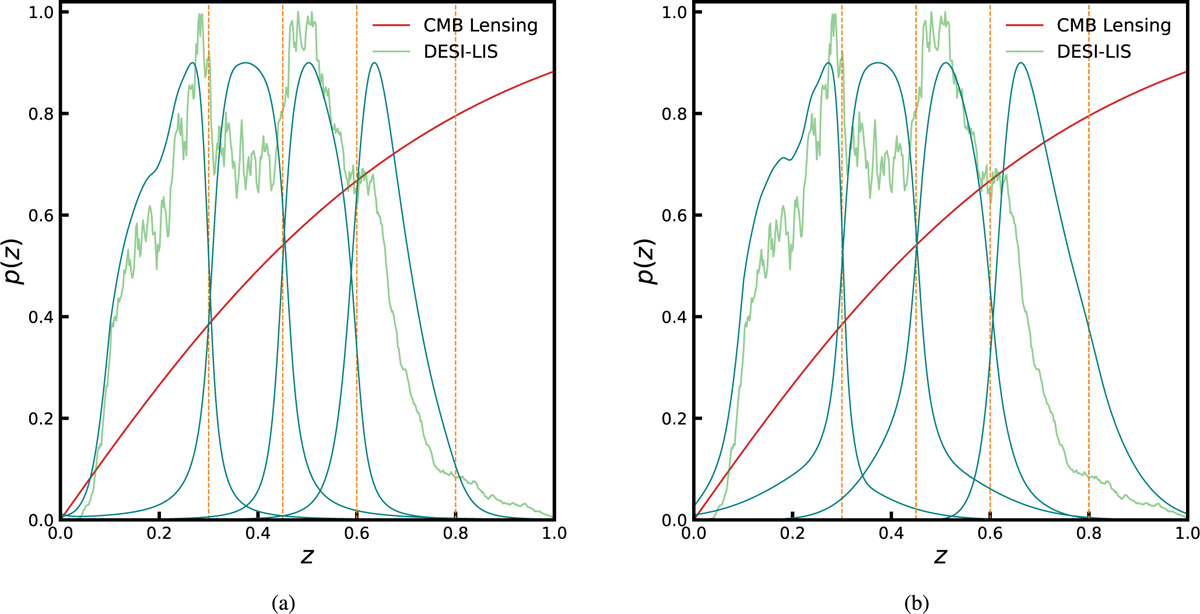
Galaxy redshift distributions estimated using Eq. (4) for four tomographic bins shown in blue lines estimated using (a) modified Lorentzian and (b) sum of Gaussians fit to the photometric redshift error distribution. The red line marks the CMB lensing kernel and the green line shows the total redshift distribution of DESI-LIS galaxies. The dashed vertical orange lines mark the boundaries for the four tomographic bins. The CMB lensing kernel and redshift distributions are normalised to the unit maximum for illustration.
Current usage metrics show cumulative count of Article Views (full-text article views including HTML views, PDF and ePub downloads, according to the available data) and Abstracts Views on Vision4Press platform.
Data correspond to usage on the plateform after 2015. The current usage metrics is available 48-96 hours after online publication and is updated daily on week days.
Initial download of the metrics may take a while.