Fig. A.1
Download original image
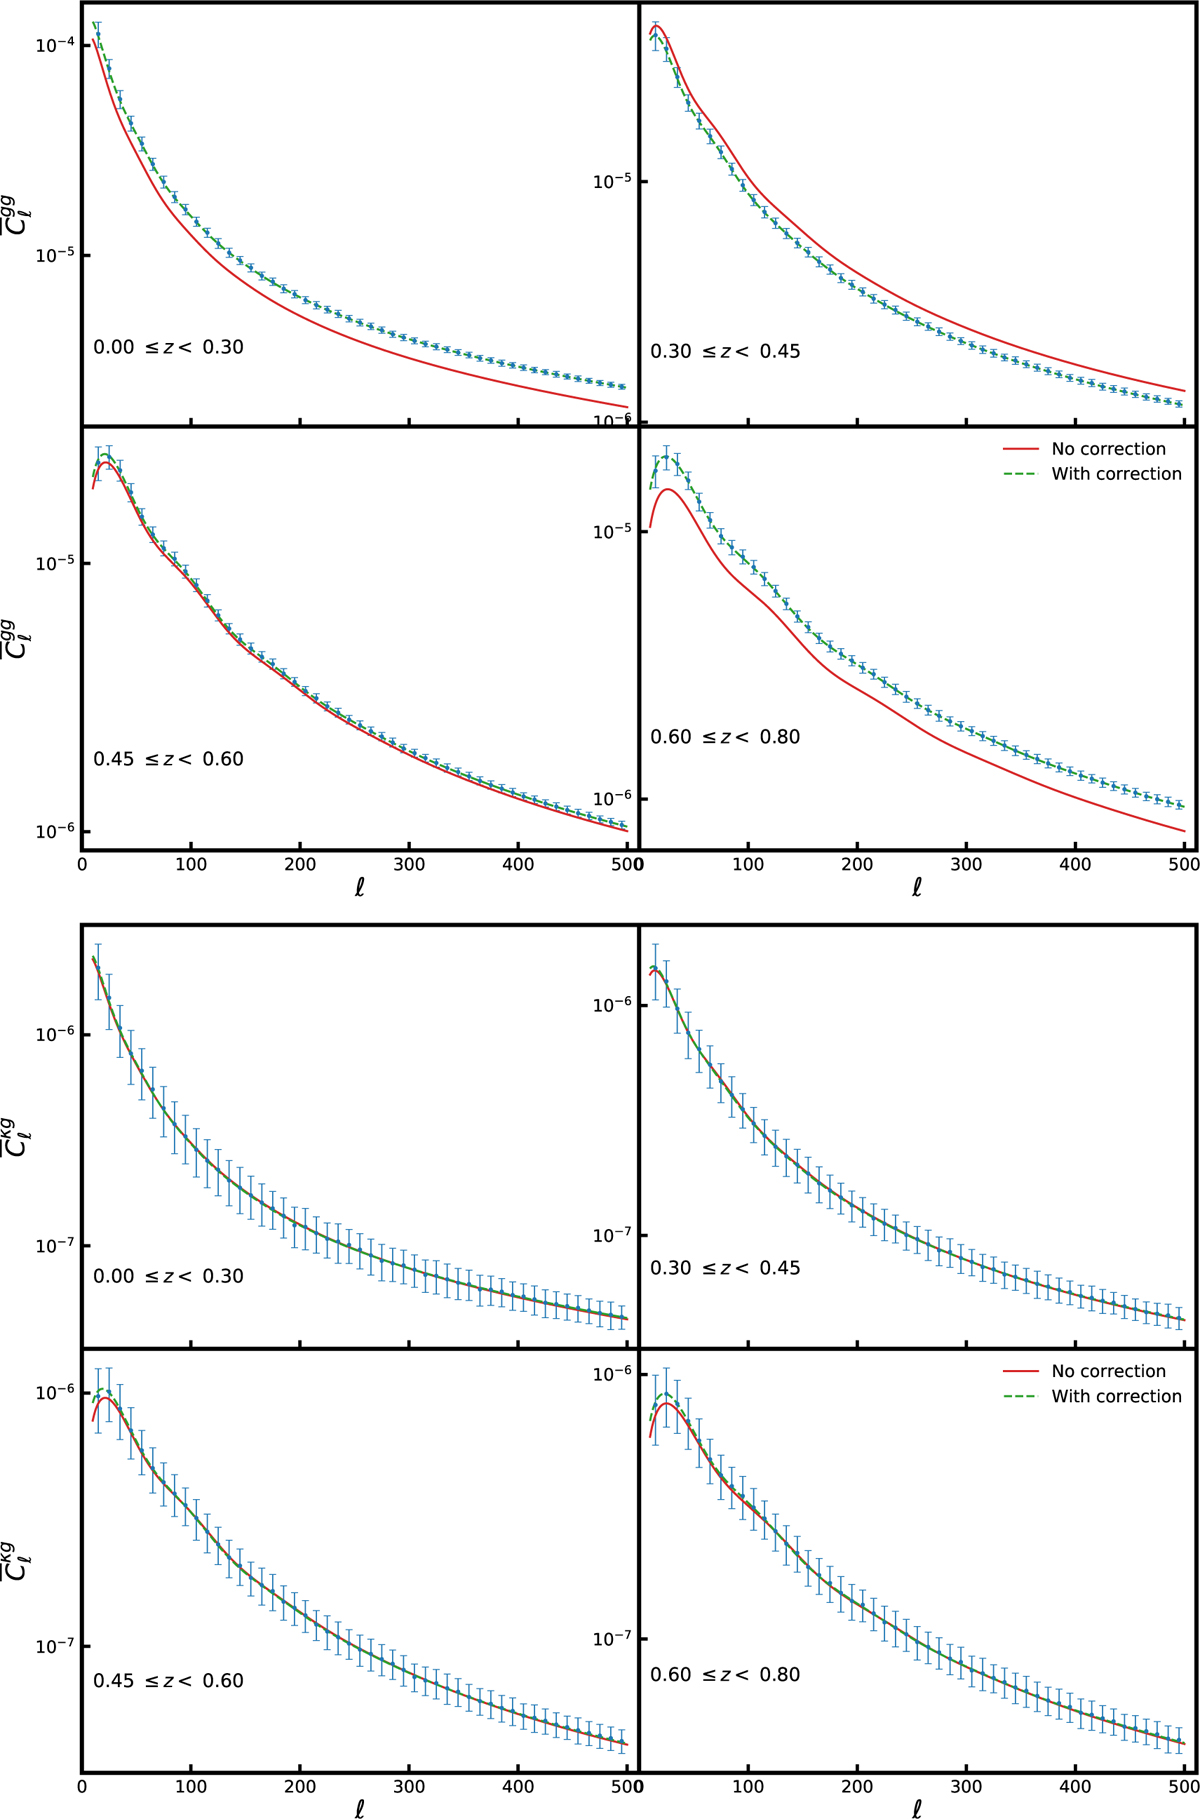
(Top:) Galaxy auto-power spectra and (bottom:) cross-power spectra averaged from 300 simulations. The red solid lines are the theoretical power spectra estimated from Eq. (4) and the green dashed lines are the leakage corrected theoretical power spectra. The standard error bars on the data points are estimated from Eq. (18).
Current usage metrics show cumulative count of Article Views (full-text article views including HTML views, PDF and ePub downloads, according to the available data) and Abstracts Views on Vision4Press platform.
Data correspond to usage on the plateform after 2015. The current usage metrics is available 48-96 hours after online publication and is updated daily on week days.
Initial download of the metrics may take a while.