Open Access
Fig. A.1.
Download original image
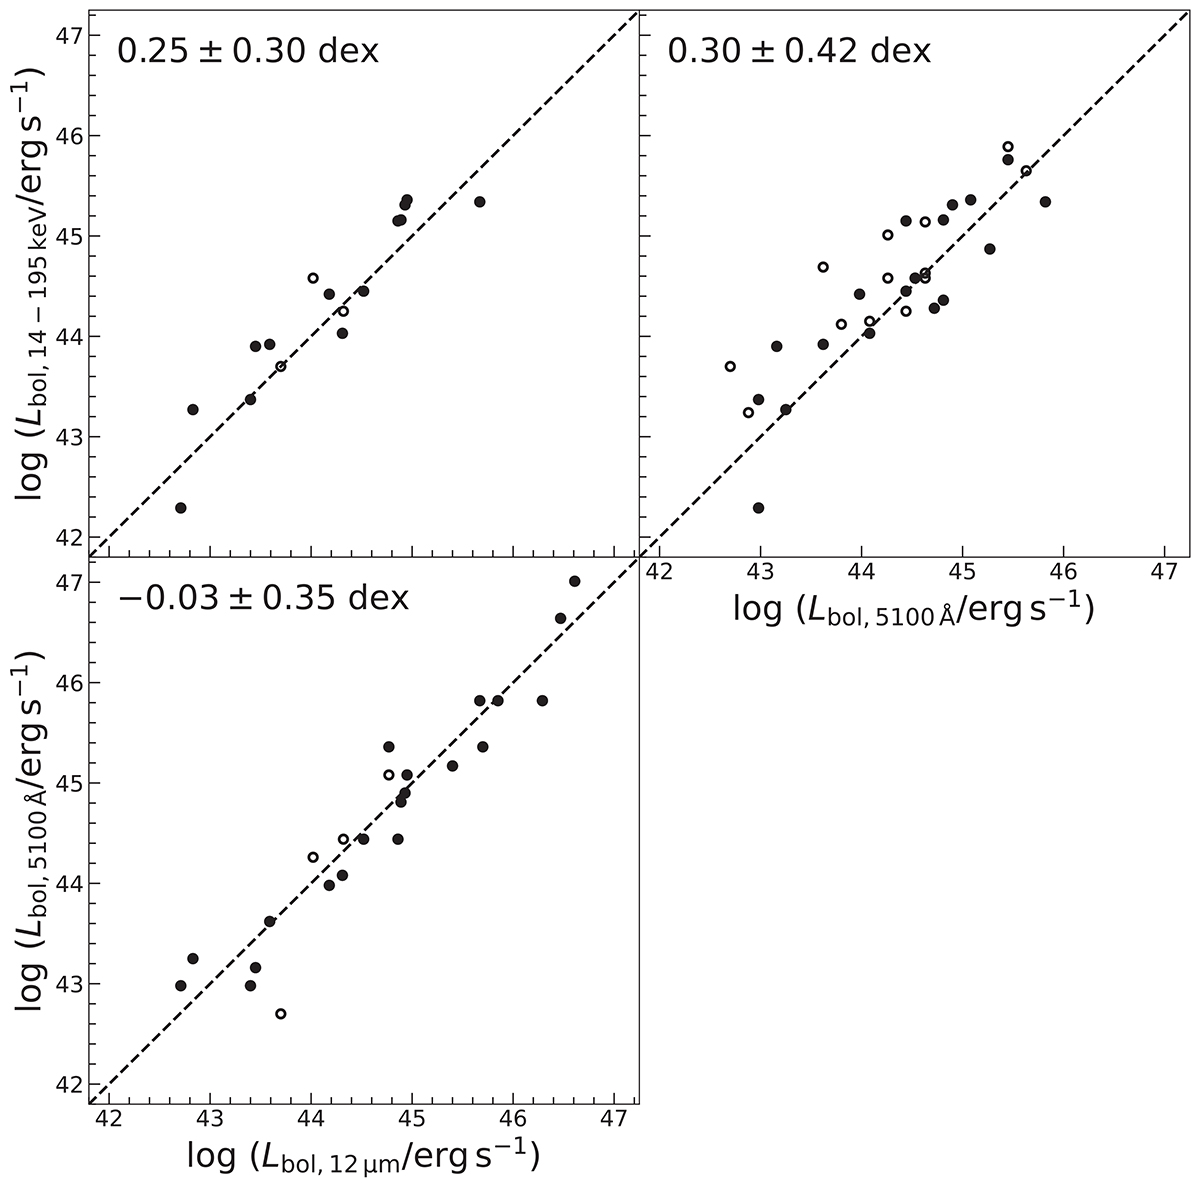
Comparisons of Lbol corrections from different measurements. The solid dots highlight the sources with OI measured sizes. The dashed lines show the one-to-one relation. The median and standard deviation of y − x are shown in the top-left corner in each panel.
Current usage metrics show cumulative count of Article Views (full-text article views including HTML views, PDF and ePub downloads, according to the available data) and Abstracts Views on Vision4Press platform.
Data correspond to usage on the plateform after 2015. The current usage metrics is available 48-96 hours after online publication and is updated daily on week days.
Initial download of the metrics may take a while.